288 Chapter 8: Confidence Interval Estimation
CHAPTER 8
8.1 X ±Z ?σ
n
= 85±1.96?
864 83.04 ≤μ≤ 86.96
8.2 X ±Z ?
σ
n
= 125±2.58?24
36
114.68 ≤μ≤ 135.32
8.3 If all possible samples of the same size n are taken, 95% of them include the true population average monthly sales of the product within the interval developed. Thus you are 95 percent confident that this sample is one that does correctly estimate the true average amount. 8.4
Since the results of only one sample are used to indicate whether something has gone wrong in the production process, the manufacturer can never know with 100% certainty that the specific interval obtained from the sample includes the true population mean. In order to have 100% confidence, the entire population (sample size N ) would have to be selected.
8.5
To the extent that the sampling distribution of sample means is approximately normal, it is true that approximately 95% of all possible sample means taken from samples of that same size will fall within 1.96 times the standard error away from the true population mean. But the population mean is not known with certainty. Since the manufacturer estimated the mean would fall between 10.99408 and 11.00192 inches based on a single sample, it is not necessarily true that 95% of all sample means will fall within those same bounds. 8.6 Approximately 5% of the intervals will not include the true population. Since the true population mean is not known, we do not know for certain whether it is contained in the interval (between 10.99408 and 11.00192 inches) that we have developed.
8.7 (a) X ±Z ?σ
n
=0.995±2.58?
0.02
50
0.9877≤μ≤1.0023
(b) Since the value of 1.0 is included in the interval, there is no reason to believe that the mean is different from 1.0 gallon.
(c) No. Since σ is known and n = 50, from the Central Limit Theorem, we may assume that the sampling distribution of X is approximately normal.
(d) The reduced confidence level narrows the width of the confidence interval.
X ±Z ?
σ
n
=0.995±1.96?
0.02
50
0.9895≤μ≤1.0005
(b)
Since the value of 1.0 is still included in the interval, there is no reason to believe that the mean is different from 1.0 gallon.
Solutions to End-of-Section and Chapter Review Problems 289
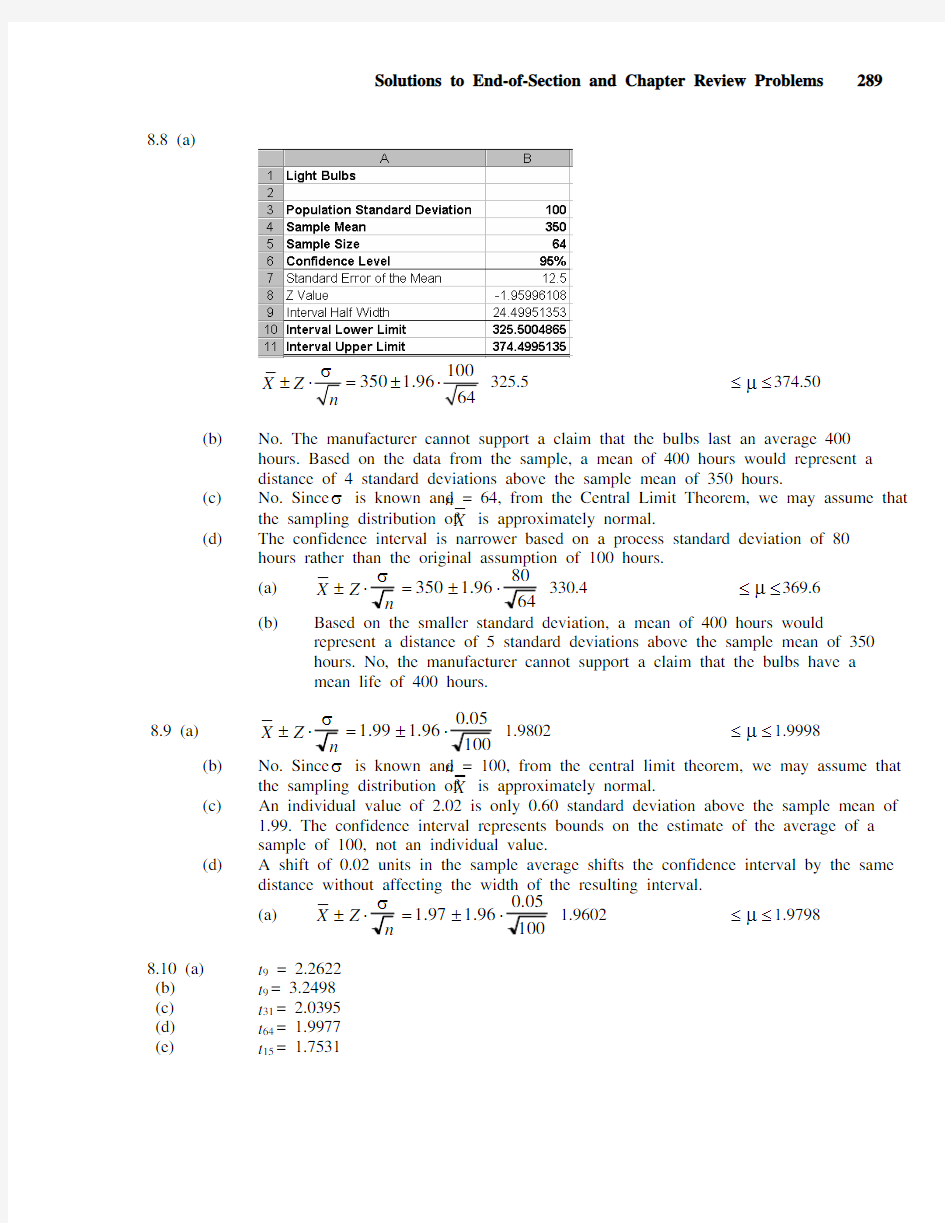
8.8 (a)
350 1.96
X Z ±=± 325.5≤μ≤374.50
(b) No. The manufacturer cannot support a claim that the bulbs last an average 400 hours. Based on the data from the sample, a mean of 400 hours would represent a distance of 4 standard deviations above the sample mean of 350 hours.
(c)
No. Since σ is known and n = 64, from the Central Limit Theorem, we may assume that the sampling distribution of X is approximately normal.
(d) The confidence interval is narrower based on a process standard deviation of 80
hours rather than the original assumption of 100 hours.
(a)
X ±Z ?σ
n
=350±1.96?
80
64
330.4≤μ≤369.6
(b)
Based on the smaller standard deviation, a mean of 400 hours would
represent a distance of 5 standard deviations above the sample mean of 350 hours. No, the manufacturer cannot support a claim that the bulbs have a mean life of 400 hours.
8.9 (a) X ±Z ?
σ
n
=1.99±1.96?
0.05
100
1.9802≤μ≤1.9998 (b) No. Since σ is known and n = 100, from the central limit theorem, we may assume that
the sampling distribution of X is approximately normal.
(c) An individual value of 2.02 is only 0.60 standard deviation above the sample mean of 1.99. The confidence interval represents bounds on the estimate of the average of a sample of 100, not an individual value.
(d)
A shift of 0.02 units in the sample average shifts the confidence interval by the same distance without affecting the width of the resulting interval.
(a)
X ±Z ?σ
n
=1.97±1.96?
0.05
100
1.9602≤μ≤1.9798
8.10 (a) t 9 = 2.2622 (b) t 9 = 3.2498 (c) t 31 = 2.0395 (d) t 64 = 1.9977 (e) t 15 = 1.7531
290 Chapter 8: Confidence Interval Estimation 8.11 75 2.0301
X t ±=± 66.8796 ≤μ≤ 83.1204 8.12 50 2.9467
X t ±=± 38.9499 ≤μ≤ 61.0501
8.13 Set 1: 4.5±2.3646?
3.7417
8 1.3719 ≤μ≤ 7.6281 Set 2: 4.5±2.3646?2.4495
8
2.4522 ≤μ≤ 6.5478
The data sets have different confidence interval widths because they have different values for
the standard deviation.
8.14 Original data:
5.8571±2.4469?
6.4660
7 – 0.1229 ≤μ≤ 11.8371 Altered data: 4.00±2.4469?2.1602
7
2.0022 ≤μ≤ 5.9978
The presence of an outlier in the original data increases the value of the sample mean and greatly inflates the sample standard deviation.
8.15 (a) 1.67 2.0930
X t ±=± $1.52 ≤μ≤ $1.82
(b)
The store owner can be 95% confident that the population mean retail value of
greeting cards that the store has in its inventory is somewhere in between $1.52 and $1.82. The store owner could multiply the ends of the confidence interval by the number of cards to estimate the total value of her inventory.
8.16 (a) 32 2.0096
X t ±=± 29.44 ≤μ≤ 34.56 (b) The quality improvement team can be 95% confident that the population mean
turnaround time is somewhere in between 29.44 hours and 34.56 hours.
(c)
The project was a success because the initial turnaround time of 68 hours does not fall inside the 95% confidence interval.
8.17 (a) 195.3 2.1098
X t ±=±≤μ≤ 205.9419 (b)
No, a grade of 200 is in the interval.
(c) It is not unusual. A tread-wear index of 210 for a particular tire is only 0.69 standard deviation above the sample mean of 195.3.
8.18 (a) 23 2.0739
X t ±=±≤μ≤ $24.99 (b) You can be 95% confident that the mean bounced check fee for the population is
somewhere between $21.01 and $24.99.
Solutions to End-of-Section and Chapter Review Problems 291
8.19 (a)
7.1538 2.0595X t ±=±≤μ≤ $8.39 (b)
You can be 95% confident that the population mean monthly service fee, if a
customer’s account falls below the minimum required balance, is somewhere between $5.92 and $8.39.
8.20 (a)
43.04 2.0096X t ±=±≤μ≤ 54.96 (b) The population distribution needs to be normally distribution.
(c)
Normal Probability Plot
-3
-2-10123
Z Value
D
a y s
Box-and-whisker Plot
050100150
Both the normal probability plot and the box-and-whisker plot suggest that the distribution is skewed to the right.
(d)
Even though the population distribution is not normally distributed, with a sample of 50, the t distribution can still be used due to the Central Limit Theorem.
292 Chapter 8: Confidence Interval Estimation
8.21 (a)
43.8889 2.0555X t ±=± 33.89 ≤μ≤ 53.89 (b) The population distribution needs to be normally distributed.
(c)
Box-and-whisker Plot
1030507090
Normal Probability Plot
0102030405060708090100-2
-1.5
-1
-0.5
0.5
1
1.5
2
Z Value
T i m e
Both the normal probability plot and the box-and-whisker show that the population distribution is not normally distributed and is skewed to the right.
8.22 (a)
182.4 2.0930X t ±=± $161.68 ≤μ≤ $203.12
(b) 45 2.0930X t ±=± $40.31 ≤μ≤ $49.69
(c)
The population distribution needs to be normally distributed.
Solutions to End-of-Section and Chapter Review Problems 293
8.22 (d) cont.
Normal Probability Plot
050100150200
250300-2
-1.5
-1
-0.5
0.5
1
1.5
2
Z Value
H o t e l
Box-and-whisker Plot
110160210260310
Both the normal probability plot and the box-and-whisker show that the population distribution for hotel cost is not normally distributed and is skewed to the right.
294 Chapter 8: Confidence Interval Estimation
8.22 (d) cont.
Normal Probability Plot
010********
607080-2
-1.5
-1
-0.5
00.5
1
1.5
2
Z Value
C a r s
Box-and-whisker Plot
30
40
50
60
70
Both the normal probability plot and the box-and-whisker show that the population distribution for rental car cost is not normally distributed and is skewed to the right.
Solutions to End-of-Section and Chapter Review Problems 295
8.23 (a)
0.00023 1.9842X t ±=?± –0.000566 ≤μ≤ 0.000106
(b)
The population distribution needs to be normally distributed. However, with a sample
of 100, the t distribution can still be used as a result of the Central Limit Theorem even if the population distribution is not normal.
(c)
Both the normal probability plot and the box-and-whisker plot suggest that the distribution is skewed to the right.
(d)
We are 95% confident that the mean difference between the actual length of the steel part and the specified length of the steel part is between -0.000566 and 0.000106 inches, which is narrower than the plus or minus 0.005 inches requirement. The steel mill is doing a good job at meeting the requirement. This is consistent with the finding in Problem 2.23.
Normal Probability Plot
-0.004
-0.003-0.002-0.00100.001
0.0020.003
0.0040.0050.006
Z Value
E r r o
r
Box-and-whisker Plot
-0.006-0.004-0.00200.0020.0040.006
296 Chapter 8: Confidence Interval Estimation
8.24
50
200
X p n =
=
= 0.25 0.25p Z ±=±
0.19 π≤≤ 0.31
8.25
25400
X p n =
== 0.0625 0.0625p Z ±=± 0.0313 0.0937
8.26 (a)
135
500
X p n =
=
= 0.27 0.27p Z ±=±
0.22
π≤≤ 0.32
(b)
The manager in charge of promotional programs concerning residential customers can infer that the proportion of households that would purchase an additional
telephone line if it were made available at a substantially reduced installation cost is between 0.22 and 0.32 with a 99% level of confidence.
8.27 (a) 330
500
X p n =
=
= 0.66 0.66p Z ±=± 0.62 π≤≤ 0.70
(b) You can be 95% confident that the population proportion of highly educated women
who left careers for family reasons that want to return to work is between 0.62 and 0.70.
8.28 (a) p = 0.77 0.77p Z ±=±
0.74 π≤≤ 0.80
(b) p = 0.77 0.77p Z ±=± 0.75 π≤≤ 0.79
(c) The 95% confidence interval is wider. The loss in precision reflected as a wider
confidence interval is the price you have to pay to achieve a higher level of confidence.
Solutions to End-of-Section and Chapter Review Problems 297
8.29 (a) p = 0.27 0.27p Z ±=±
0.25 π≤≤ 0.29 (b)
You can be 95% confident that the population proportion of older consumers that don’t think they have enough time to be good money managers is somewhere between 0.25 and 0.29.
8.30 (a)
0.46X
p n
=
= 0.46p Z ±=±
0.41630.5037π<<
(b) 0.10X
p n
=
= 0.10p Z ±=±
0.07370.1263π<<
8.31 (a) p = 0.2697 0.2697p Z ±=±
0.24 π≤≤ 0.30
(b) p = 0.2697 0.2697p Z ±=±
0.23
π≤≤ 0.31 (c)
The 99% confidence interval is wider. The loss in precision reflected as a wider
confidence interval is the price one has to pay to achieve a higher level of confidence.
8.32 (a) 4500.451000
X p n =
==
0.45p Z ±=±
0.41920.4808π<<
(b) You are 95% confidence that the proportion of all working women in North America who believe that companies should hold positions for those on maternity leave for more than six months is between 0.4192 and 0.4808.
298 Chapter 8: Confidence Interval Estimation
8.33 (a)
126
0.21600
X p n =
== 0.21p Z ±=±
0.18
π≤≤ 0.24
(b)
126
0.21600
X p n === 0.21p Z ±=±
0.17
π≤≤ 0.25 (c) You are 95% confidence that the population proportion of employers who have a
mandatory mail order program in place or are adopting one by the end of 2004 is between 0.18 and 0.24.
You are 99% confidence that the population proportion of employers who have a
mandatory mail order program in place or are adopting one by the end of 2004 is between 0.17 and 0.25.
(d)
When the level of confidence is increased, the confidence interval becomes wider. The loss in precision reflected as a wider confidence interval is the price you
have to pay to achieve a higher level of confidence.
8.34 n =Z 2σ2e 2=1.962?1525
2
= 34.57 Use n = 35
8.35 n =Z 2σ2e 2=2.582?1002
20
2
= 166.41 Use n = 167
8.36 222
2(1–) 2.58(0.5)(0.5)
(0.04)Z n e ππ== = 1,040.06
Use n = 1,041
8.37 222
2(1–) 1.96(0.4)(0.6)
(0.02)Z n e ππ== = 2,304.96
Use n = 2,305
8.38 (a) n =Z 2σ2e 2=1.962?4002
502
= 245.86 Use n = 246 (b) 2222
22
1.9640025Z n e
σ?== = 983.41 Use n = 984
8.39 n =Z 2σ2e 2=1.962?(0.02)2
(0.004)2
= 96.04 Use n = 97
8.40 n =Z 2σ2e 2=1.962?(100)2
(20)2
= 96.04 Use n = 97
8.41 n =Z 2σ2e 2=1.962?(0.05)2
(0.01)
2
= 96.04 Use n = 97
Solutions to End-of-Section and Chapter Review Problems 299
8.42 (a) n =Z 2σ2e 2=2.582?252
52
= 166.41 Use n = 167 (b) n =Z 2σ2e 2=1.962?252
5
2
= 96.04 Use n = 97
8.43 (a) n =Z 2σ2e 2=1.6452?452
52
= 219.19 Use n = 220 (b) n =Z 2σ2e 2=2.582?452
5
2
= 539.17 Use n = 540
8.44 n =Z 2σ2e 2=1.962?202
5
2
= 61.47 Use n = 62
8.45 (a) 2222
(1–) 1.96(0.1577)(10.1577)
(0.06)Z n e ππ?== = 141.74 Use n = 142 (b) 2222
(1–) 1.96(0.1577)(10.1577)
(0.04)Z n e ππ?== = 318.91 Use n = 319 (c) 2222
(1–) 1.96(0.1577)(10.1577)
(0.02)Z n e
ππ?== = 1275.66 Use n = 1276
8.46 (a) 2222
(1) 1.96(0.45)(0.55)
(0.02)Z n e ππ?== = 2376.8956 Use n = 2377 (b) 2222
(1) 1.96(0.29)(0.71)
(0.02)Z n e
ππ?== = 1977.3851 Use n = 1978
(c) The sample sizes differ because the estimated population proportions are different.
(d)
Since purchasing groceries at wholesale clubs and purchasing groceries at convenience stores are not necessary mutually exclusive events, it is appropriate to use one sample and ask the respondents both questions. However, drawing two separate samples is also appropriate for the setup.
8.47 (a) 2222
(1) 1.96(0.35)(10.35)
546.2068(0.04)Z n e
ππ??=== Use n = 547 (b) ()2
2222.5758(0.35)(10.35)
(1)943.4009(0.04)Z n e ππ??=== Use n = 944
(c)
2222(1) 1.96(0.35)(10.35)
2184.8270(0.02)Z n e ππ??=== Use n = 2185 (d) ()2
222
2.5758(0.35)(10.35)
(1)3773.6034(0.02)Z n e ππ??=== Use n = 3774
(e)
Holding everything else constant, the higher the confidence level desired or the lower
the acceptable sampling error, the larger the sample size needed.
300 Chapter 8: Confidence Interval Estimation
8.48 (a) 3030.9294326
X p n ===
0.9294 1.96p Z ±=±
0.90170.9572π≤≤
(b)
You are 95% confident that the population proportion of business men and women who
have their presentations disturbed by cell phones is between 0.9017 and 0.9572.
(c) 2222(1) 1.96(0.9294)(10.9294)157.5372(0.04)Z n e ππ??=== Use n = 158
(d)
2222
(1) 2.5758(0.9294)(10.9294)
272.0960(0.04)Z n e ππ??=== Use n = 273
8.49 (a) 0.52 1.96p Z ±=±0.50530.5347π≤≤
(b)
You are 95% confident that the proportion of families that held stocks in 2001 is
between 0.5053 and 0.5347.
(c) 2222
(1) 1.96(0.52)(10.52)9588.2695(0.01)
Z n e ππ??=== Use n = 9589
8.50
The only way to have 100% confidence is to obtain the parameter of interest, rather than a sample statistic. From another perspective, the range of the normal and t distribution is infinite, so a Z or t value that contains 100% of the area cannot be obtained.
8.51 The t distribution is used for obtaining a confidence interval for the mean when σ is
unknown. 8.52 If the confidence level is increased, a greater area under the normal or t distribution needs to be included. This leads to an increased value of Z or t , and thus a wider interval.
8.53
When estimating the rate of noncompliance, it is commonplace to use a one-sided confidence interval instead of a two-sided confidence interval since only the upper bound on the rate of noncompliance is of interest.
8.54 In some applications such as auditing, interest is primarily on the total amount of a variable rather than the mean amount.
8.55 Difference estimation involves determining the difference between two amounts, rather than a single amount.
Solutions to End-of-Section and Chapter Review Problems 301
8.56 (a) The population from which this sample was drawn was the collection of all the people who visited the magazine's web site.
(b) The sample is not a random sample from this population. The sample consisted of only those who visited the magazine's web site and chose to fill out the survey. (c)
This is not a statistically valid study. There was selection bias since only those who visited the magazine's web site and chose to answer the survey were represented. There was possibly nonresponse bias as well. Visitors to the web site who chose to fill out the survey might not answer all questions and there was no way for the magazine to get back to them to follow-up on the nonresponses if this was an anonymous survey.
(d)
To avoid the above potential pitfalls, the magazine could have drawn a random sample from t he list of all subscribers to the magazine and offer them the option of filling out the survey over the Internet or on the survey form that is mailed to the subscribers. The magazine should also keep track of the subscribers who are invited to fill out the survey and follow up on the nonresponses after a specified period of time with mail or telephone to encourage them to participate in the survey.
The sample size needed is 2222
(1) 1.96(0.6195)(10.6195)
2264(0.02)
Z n e ππ??????===
8.57 (a) 0.44 1.96p Z ±=± 0.39650.4835π<<
(b)
Since the range that covers 0.5 and above is not contained in the 95% confidence
interval, we can conclude that less than half of all applications contain inaccuracies with past employers.
(c)
0.44 1.96p Z ±=± 0.37120.5088π<<
(d) Since the 95% confidence interval contains 0.5, it is incorrect to conclude that less
than half of all applications contain inaccuracies with past employers.
(e)
The smaller sample size in (c) results in a wider confidence interval and, hence, results in a loss of precision in the interval estimate.
8.58 (a) 0.58 1.96p Z ±=±0.51160.6484π<<
(b) 0.50 1.96p Z ±=±0.43070.5693π<<
(c) 0.22 1.96p Z ±=±0.16260.2774π<<
(d)
0.19 1.96p Z ±=±0.13560.2444π<<
(e) 2222
(1) 1.96(0.5)(0.5)
2400.92401(0.02)
Z n e
ππ?????===?
302 Chapter 8: Confidence Interval Estimation
8.59 Cheat at golf:
0.8204 1.96p Z ±=± 0.78290.8580π<<
Hate others who cheat at golf:
0.8204 1.96p Z ±=± 0.78290.8580π<<
Believe business and golf behavior parallel:
0.7207 1.96p Z ±=± 0.67680.7646π<<
Would let a client win to get business:
0.1995 1.96p Z ±=± 0.16040.2386π<<
Would call in sick to play golf:
0.0998 1.96p Z ±=±0.07040.1291π<<
From these confidence intervals, we can conclude with 95% level of confidence that more than
half of the CEOs will cheat at golf, hate others who cheat at golf and believe business and golf behavior parallel and less than half of the CEOs will let a client win to get business or call in sick to play golf.
8.60 (a) 15.3 2.0227
X t ±=± 14.085 ≤μ≤ 16.515
(b)
0.675 1.96p Z ±=± 0.530 π≤≤ 0.820 (c) n =Z 2?σ2e 2=1.962?522
2
= 24.01 Use n = 25
(d) 2222
(1–) 1.96(0.5)(0.5)(0.035)Z n e
ππ????== = 784 Use n = 784
(e)
If a single sample were to be selected for both purposes, the larger of the two sample
sizes (n = 784) should be used.
8.61 (a) 1759 2.6490
X t ±=± 1,638.69 ≤μ≤ 1,879.31
(b)
0.60 1.96p Z ±=±π≤≤ 0.715
Solutions to End-of-Section and Chapter Review Problems 303
8.62 (a) 9.7 2.0639
X t ±=± 8.049 ≤μ≤ 11.351
(b)
0.48 1.96p Z ±=±π≤≤ 0.676 (c) n =Z ?e 2=1.962?4.521.5
2
= 34.57 Use n = 35 (d) 2222
(1–) 1.645(0.5)(0.5)(0.075)Z n e ππ????== = 120.268 Use n = 121 (e)
If a single sample were to be selected for both purposes, the larger of the two sample
sizes (n = 121) should be used.
8.63 (a) n =Z 2?σ2e 2=2.582?182
5
2
= 86.27
Use n = 87
Note : If the Z -value used is carried out to 2.5758, the value of n is 85.986 and only 86 women would need to be sampled.
(b)
222
2(1–) 1.645(0.5)(0.5)(0.045)Z n e ππ????== = 334.07 Use n = 335
(c)
If a single sample were to be selected for both purposes, the larger of the two sample
sizes (n = 335) should be used.
8.64 (a) $28.52 1.9949
X t ±=± $25.80 ≤μ≤ $31.24
(b)
0.40 1.645p Z ±=±π≤≤ 0.4963 (c) n =Z ?σe 2=1.962?10222
= 96.04 Use n = 97 (d) 2
222
(1–) 1.645(0.5)(0.5)(0.04)Z n e ππ????== = 422.82 Use n = 423 (e) If a single sample were to be selected for both purposes, the larger of the two sample
sizes (n = 423) should be used.
8.65 (a) $21.34 1.9949
X t ±=± $19.14 ≤μ≤ $23.54
(b) 0.3714 1.645p Z ±=±
0.2764 π≤≤ 0.4664
(c)
n =Z 2
?σ2
e 2=1.962
?102
1.5
2
= 170.74 Use n = 171 (d)
2222(1–) 1.645(0.5)(0.5)(0.045)Z n e ππ????== = 334.08 Use n = 335
304 Chapter 8: Confidence Interval Estimation
8.65 (e) If a single sample were to be selected for both purposes, the larger of the two sample cont. sizes (n = 335) should be used.
8.66 (a)
$38.54 2.0010
X t ±=±≤μ≤ $40.42
(b) 0.30 1.645p Z ±=±π≤≤ 0.3973 (c) n =Z 2?σ2e 2=1.962?821.5
2
= 109.27 Use n = 110 (d) 2222
(1–) 1.645(0.5)(0.5)(0.04)
Z n e ππ????== = 422.82 Use n = 423 (e)
If a single sample were to be selected for both purposes, the larger of the two sample
sizes (n = 423) should be used.
8.67 (a) 2222
(1) 1.96(0.5)(0.5)
(0.05)Z n e
ππ?????== = 384.16 Use n = 385
If we assume that the population proportion is only 0.50, then a sample of 385 would
be required. If the population proportion is 0.90, the sample size required is cut to 103.
(b) 0.84 1.96p Z ±=± 0.7384
≤ π ≤ 0.9416 (c) The representative can be 95% confidence that the actual proportion of bags that will do
the job is between 74.5% and 93.5%. He/she can accordingly perform a cost-benefit analysis to decide if he/she wants to sell the Ice Melt product.
8.68 (a) 8.4209 2.0106
X t ±=± 8.418.43μ≤≤
(b) With 95% confidence, the population mean width of troughs is somewhere between 8.41
and 8.43 inches. Hence, the company's requirement of troughs being between 8.31 and 8.61 is being met with a 95% level of confidence.
8.69 (a) 5.5014 2.6800
X t ±=± 5.46 5.54μ≤≤
(b) Since 5.5 grams is within the 99% confidence interval, the company can claim that the
mean weight of tea in a bag is 5.5 grams with a 99% level of confidence.
Solutions to End-of-Section and Chapter Review Problems 305
8.70 (a)
0.2641 1.9741X t ±=±0.24250.2856μ≤≤
(b)
0.218 1.9772X t ±=±0.19750.2385μ≤≤
(c)
Normal Probability Plot
00.10.20.30.40.50.60.70.80.9-3
-2
-1
1
2
3
Z Value
V e r m o n t
Normal Probability Plot
00.20.40.60.81
1.2-3
-2
-1
1
2
3
Z Value
B o s t o n
The amount of granule loss for both brands are skewed to the right.
(d)
Since the two confidence intervals do not overlap, we can conclude that the mean granule loss of Boston shingles is higher than that of Vermont Shingles.
306 Chapter 8: Confidence Interval Estimation
8.71 (a)
3124.2147 1.9665X t ±=±3120.663127.77μ≤≤
(b)
3704.0424 1.9672X t ±=± 3698.98<3709.10μ<
(c)
Normal Probability Plot
3000
30503100315032003250
3300-4
-3
-2
-1
1
2
3
4
Z Value
B o s t o n
Normal Probability Plot
3550
36003650370037503800
38503900-4
-3
-2
-1
1
2
3
4
Z Value
V e r m o n t
The weight for Boston shingles is slightly skewed to the right while the weight for Vermont shingles appears to be slightly skewed to the left.
(d)
Since the two confidence intervals do not overlap, the mean weight of Vermont shingles is greater than the mean weight of Boston shingles.
Solutions to End-of-Section and Chapter Review Problems 307
8.72
(a)
NY, Food: 20.1 2.0096
X t ±=± 19.5120.69μ≤≤ LI, 20.54 2.0096
X t ±=± 19.7321.35μ≤≤ NY, 17.12 2.0096
X t ±=± 16.3517.89μ≤≤ LI, 17.64 2.0096
X t ±=± 16.6518.63μ≤≤ NY, 18.4 2.0096
X t ±=± 17.7419.06μ≤≤ LI, 19.04 2.0096
X t ±=±18.3719.71μ≤≤
NY, 39.74 2.0096
X t ±=± 37.0042.48μ≤≤ LI, 33.7400 2.0096
X t ±=± 31.5535.93μ≤≤
(b)
With 95% confidence you can conclude the mean price per person in New York City is
greater than the mean in Long Island. With 95% confidence you can conclude that there are no differences in the ratings for food, décor and service between the two cities.
命题方式:统一命题 佛山科学技术学院2014—2015学年第二学期 《商务统计学》课程期末考试试题C答案 专业班级:13级经济管理1~10班任课老师:辛焕平、贲雪峰、靳娜 一、判断题(1分×15=15分) 二、单项选择题(1分×15=15分) 三、多项选择题(2分×10=20分) 四、简答题(6分×2=12分) 1、答:根据研究的目的与要求,结合研究对象的特点,把统计总体按照某一标志划分为若干性质不同而有联系的几个部分,这种分类就叫统计分组。 要求:(1)根据研究的目的选择分组标志;(2)要选择反映研究对象本质或主要特征的标志;(3)严格遵守分组的穷举性和互斥性原则;(4)要结合研究对象所处的具体历史条件或经济条件来选择分组标志。 2、答:(1)时期指标数值可以相加,而时点指标数值直接相加没有实际的经济意义;(2)时期指标数值的大小与时期长短同方向变化,而时点指标数值的大小与时间间隔长短
没有直接联系;(3)时期指标一般通过连续登记加总求得,而时点指标通过间断的登记方法取得。 五、综合业务计算题(1小题6分,2、3小题各10分,4小题12分,共38分) 1、 解:季平均劳动生产率2 254321 b b b b b a ++++= ∑ = 24180 413540954110241001960 200019501000+++++++ = 16480 6910 =0.4193(万元/人) 年劳动生产率 = 季平均劳动生产率×4 = 0.4193×4= 1.6772(万元/人) (1)∑∑= f xf x = 97000/100=970(小时) 抽样的100只灯管的平均耐用时间是970小时 (2)用样本方差代替总体方差 (小时))(13600100 1360000 2 2== -= ∑∑f f x x x δ 抽样平均误差) ()(1000 1 11001360012 -=-= N n n x τδμ=11.66 抽样极限误差98.3466.113=?==?τμt x 区间范围98.34970±=?±=τx X =935.02~1004.98(小时) 在99.73%的概率保证程度下,估计10万只灯管平均耐用时间的区间范围为935.02小时~ 1004.98小时。
VB 课后练习题参考答案 第一章 一、 1、C 2、C 3、B 4、B 5、D 6、B 7、B 8、D 二、 1、学习版、专业版、企业版 2、alt+Q 或 alt+F4 3、.vbp 、 .frm 4、固定、浮动 5、"abcd"、"VB Programing" 6、属性窗口、运行 7、对象框、事件框 8、窗体模块、标准模块、类模块 第二章 一、 1、B 2、B 3、B 4、B 5、D 6、D 二、 1、((x+y)+z)*80-5*(C+D) 2、cos(x)*sin(sin(x)+1 3、2*a*(7+b) 4、8*EXP(3)*LOG(2) 5、good morning 、 good morning 6、2001/8/25 8 2001 7 第三章 一、 1、C 2、B 3、D 4、A 5、D 、 3 6、C 7、B 8、C 9、C 10、D 11、B 12、C 13、B 14、B 15、A 16、B 17、D 18、C 19、C 二、 1、AutoSize 2、text1.setfocus 3、0 、 0 4、 picture1.picture=loadpic ture("yy.gif") 5、stretch 6、interval 7、enable 8、下拉式组合框、简单组 合框、下拉式列表框、style 9、下拉式列表框 10、条目1 、条目3 11、欢迎您到中国来、 welcome to china!! 第四章 一、 1、B 2、C 3、C 4、B 5、C 6、B 7、C 8、B 9、D 10、A 11、B 12、A 13、B 14、D 15、A 16、B 17、A 18、C 19、B 二、 1、2542=57 2、beijing 3、002.45、2.449、 24.49e-01、-2.449 4、9 10 11 5、9 6、1 2 3 7、 iif(x<=0,y=0,iif(x<=10, y=5+2*x,iif(x<=15,y=x- 5,y=0))) 8、x=7 或 x>6 或 x>5 9、x>=0 、x 第三章节:数据的图表展示 (1) 第四章节:数据的概括性度量 (15) 第六章节:统计量及其抽样分布 (26) 第七章节:参数估计....................................................... (28) 第八章节:假设检验........................................................ (38) 第九章节:列联分析........................................................ (41) 第十章节:方差分析........................................................ (43) 3.1 为评价家电行业售后服务的质量,随机抽取了由100个家庭构成的一个样本。服务质量的等级分别表示为:A.好;B.较好;C一般;D.较差;E.差。调查结果如下: B E C C A D C B A E D A C B C D E C E E A D B C C A E D C B B A C D E A B D D C C B C E D B C C B C D A C B C D E C E B B E C C A D C B A E B A C E E A B D D C A D B C C A E D C B C B C E D B C C B C 要求: (1)指出上面的数据属于什么类型。 顺序数据 (2)用Excel制作一张频数分布表。 用数据分析——直方图制作: 接收频率 E16 D17 C32 B21 A14 (3)绘制一张条形图,反映评价等级的分布。 用数据分析——直方图制作: (4)绘制评价等级的帕累托图。 逆序排序后,制作累计频数分布表: Assignment 2 1. The amount of bleach a machine pours into bottles has a mean of 36 oz. with a standard deviation of 0.15 oz. Suppose we take a random sample of 36 bottles filled by this machine. What is the probability that the mean of the sample is greater than 35.94 oz? 4.236 15 .03694.35-=-=-=x x X Z σμ )4.2()4.2(Φ=->Φx The area corresponding to Z=2.4 in Table E.2 is 0.9918 Because the probability that the mean of the sample is greater than 35.94 oz,so the value is 0.9918. 2. Page 186-- Answer questions in 7.47 (b),(c) (b)60.150002 .098.098.099.0)1(60.150002 .098.098.097.0)1(2211=?-=--=-=?-=--= n p Z n p Z ππππππ 9452.0)60.1(=Φ 1-2(1-0.9452)=0.8904 Using Table E.2,the area between 97% and 99% with Internet access is 0.8904,only 89.04% of the samples of n=500 would be expected to have sample between 97% and 99% with Internet access. (c))60.1()60.1(60.1500 02.098.098.097.0)1(11>Φ=-<Φ-=?-=--= x x n p Z πππ 9452.0)60.1(=Φ 1-0.9452=0.0548 Using Table E.2,the area less than 97% with Internet access is 0.0548,only 5.48% of the samples of n=500 would be expected to have sample less than 97% with Internet access. 习题 一、单项选择题 1. 在设计阶段,当双击窗体上的某个控件时,所打开的窗体是_____。 A. 工程资源管路器窗口 B. 工具箱窗体 C. 代码窗体 D. 属性窗体 2. VB中对象的含义是_____。 A. 封装了数据和方法的实体 B. 封装的程序 C. 具有某些特性的具体事物的抽象 D. 创建对象实例的模板 3. 窗体Form1的Name属性是MyForm,它的单击事件过程名是_____。 A. MyForm_Click B. Form_Click C. Form1_Click D. Frm1_Click 4. 如果要改变窗体的标题,需要设置窗体对象的_____属性。 A. BackColor B. Name C. Caption D. Font 5. 若要取消窗体的最大化功能,可将其_____属性设置为False来实现。 A. Enabled B.ControlBox C. MinButton D. MaxButton 6. 若要以代码方式设置窗体中显示文本的字体大小,可通过设置窗体对象_____属性来实现。 A. Font B.FontName C.FontSize D. FontBold 7. 确定一个控件在窗体上位置的属性是_____。 A. Width或Height B. Width和Height C. Top或Left D. Top和Left 8. 以下属性中,不属于标签的属性是_____。 A. Enabled B. Default C. Font D. Caption 9. 若要设置标签控件中文本的对齐方式,可通过_____属性实现。 A.Align B. AutoSize C. Alignment D. BackStyle 10. 若要使标签控件的大小自动与所显示文本的大小相适宜,可将其_____属性设置为True来实现。 A.Align B. AutoSize C. Alignment D. Visible 11. 若要设置或返回文本框中的文本,可通过设置其_____属性来实现。 A.Caption B. Name C. Text D. (名称) 12. 若要设置文本框最大可接受的字符数,可通过设置其_____属性来实现。 ●3.2.某行业管理局所属40个企业2002年的产品销售收入数据如下(单位:万元): 1521241291161001039295127104 10511911411587103118142135125 117108105110107137120136117108 9788123115119138112146113126 (1)根据上面的数据进行适当的分组,编制频数分布表,并计算出累积频数和累积频率; (2)如果按规定:销售收入在125万元以上为先进企业,115万~125万元为良好企业,105万~115万元为一般企业,105万元以下为落后企业,按先进企业、良好企业、一般企业、落后企业进行分组。 解:(1)要求对销售收入的数据进行分组, 全部数据中,最大的为152,最小的为87,知数据全距为152-87=65; 为便于计算和分析,确定将数据分为6组,各组组距为10,组限以整10划分; 为使数据的分布满足穷尽和互斥的要求,注意到,按上面的分组方式,最小值87可能落在最小组之下,最大值152可能落在最大组之上,将最小组和最大组设计成开口形式; 按照“上限不在组内”的原则,用划记法统计各组内数据的个数——企业数,也可以用Excel 进行排序统计(见Excel练习题2.2),将结果填入表内,得到频数分布表如下表中的左两列;将各组企业数除以企业总数40,得到各组频率,填入表中第三列; 在向上的数轴中标出频数的分布,由下至上逐组计算企业数的向上累积及频率的向上累积,由上至下逐组计算企业数的向下累积及频率的向下累积。 整理得到频数分布表如下: 40个企业按产品销售收入分组表 (2)按题目要求分组并进行统计,得到分组表如下: 某管理局下属40个企分组表 按销售收入分组(万元)企业数(个)频率(%) 先进企业良好企业一般企业落后企业11 11 9 9 27.5 27.5 22.5 22.5 合计40100.0 一、The manager of the customer service division of a major consumer electronics company is interested in determining whether the customers who have purchased a videocassette recorder made by the company over the past 12 months are satisfied with their products. 1., the population of interest is a)all the customers who have bought a videocassette recorder made by the company over the past 12 months. b)all the customers who have bought a videocassette recorder made by the company and brought it in for repair over the past 12 months. c)all the customers who have used a videocassette recorder over the past 12 months. d)all the customers who have ever bought a videocassette recorder made by the company. ANSWER: a 2., which of the following will be a good frame for drawing a sample? a)Telephone directory. b)Voting registry. c)The list of customers who returned the registration card. d) A list of potential customers purchased from a database marketing company. ANSWER: c 3.the possible responses to the question "How many videocassette recorders made by other manufacturers have you used?" are values from a a)discrete random variable. b)continuous random variable. c)categorical random variable. d)parameter. ANSWER: a 4.the possible responses to the question "Are you happy, indifferent, or unhappy with the performance per dollar spent on the videocassette recorder?" are values from a a)discrete numerical random variable. b)continuous numerical random variable. c)categorical random variable. d)parameter. ANSWER: c 《VB程序设计》综合复习资料 第一章 Visual Basic程序设计概述 一、填空题 1、Visual Basic是一种面向__________的可视化程序设计语言,采取了__________的编程机制。 2、在VB中工程文件的扩展名是____________,窗体文件的扩展名是____________,标准模块文件的扩展名是____________。 3、执行“工程”菜单下的__________命令,可选择并添加ActiveX控件。 4、Visual Basic 6.0用于开发__________环境下的应用程序。 二、选择题 1、下面不是VB工作模式的是() A.设计模式B.运行模式C.汇编模式D.中断模式 2、可视化编程的最大优点是() A.具有标准工具箱 B.一个工程文件由若干个窗体文件组成 C.不需要编写大量代码来描述图形对象 D.所见即所得 3、下列不能打开属性窗口的操作是() A.执行“视图”菜单中的“属性窗口”命令 B.按F4键 C.按Ctrl+T D.单击工具栏上的“属性窗口”按钮 4、下列可以打开立即窗口的操作是() A.Ctrl+D B.Ctrl+E C.Ctrl+F D.Ctrl+G 5、Visual Basic的编程机制是() A.可视化 B.面向对象 C.面向图形 D.事件驱动 三、简答题 1、代码窗口主要包括哪几部分? 2、在工程资源管理器窗口中,主要列出了哪三类文件? 3、窗体布局窗口的主要用途是什么? 4、VB的基本特点是什么? 5、怎样理解可视化设计? 6、怎要理解事件驱动编程? 第二章简单的VB程序设计 一、填空题 1、设置是否可以用Tab键来选取命令按钮,应该用______________属性。 2、一个控件在窗体的位置由_______和________属性决定,其大小由__________和_________属性决定。 3、利用对象的属性setfocus可获得焦点,对于一个对象,只有其visible属性和____________属性为true,才能接受焦点。 4、设置控件背景颜色的属性名称是______________________。 5、所有控件都具有的共同属性是__________________属性。 6、一般情况下,控件有两个属性项的缺省值是相同的,这两个属性项是_______________。 7、VB中的每个对象(控件)都有一组特征,这组特征称为__________,我们通过修改它可以控制对象的外观和操作。 8、通常情况下,VB中一个工程主要包括如下四个文件:窗体文件、工程文件、类模块文件和_____________文件,后者的扩展名为.Bas,通常由Basic语言编写,是一个可共用的子程序。 9、VB有三种工作模式,分别是设计(Design)模式、_____________和中断(Break)模式。 二、选择题 1、以下能够触发文本框Change事件的操作是() 2016慕课毛概最全答案 第一章 1.1.马克思主义中国化的科学内涵 1 毛泽东在明确提出“使马克思主义中国化”的命题和任务是在 A、遵义会议 B、中共六届六中全会 C、中共七大 D、中共七届二中全会 正确答案:B 我的答案:B 得分:16.7分 2 在党的七大上,对“马克思主义中国化”、“中国化的马克思主义”两大科学命题加以阐释的党的领导人是 A、毛泽东 B、周恩来 C、邓小平 D、刘少奇 正确答案:D 我的答案:D 得分:16.7分 3 中国共产党确定毛泽东思想为指导思想的会议是 A、遵义会议 B、党的第七次全国代表大会 C、党的第八次全国代表大会 D、中共十一届六中全会 正确答案:B 我的答案:B 得分:16.7分 4 马克思主义中国化的理论成果的精髓是 A、实事求是 B、毛泽东思想 C、邓小平理论 D、“三个代表”重要思想 正确答案:A 我的答案:A 得分:16.7分 5 中国共产党在把马克思列宁主义基本原理与中国革命实际相结合的过程中,在学风问题上曾经反对过的主要错误倾向是 A、投降主义 B、经验主义 C、教条主义 D、冒险主义 正确答案:BC 我的答案:AC 得分:0.0分 6 毛泽东思想和中国特色社会主义理论体系都是中国化的马克思主义,它们都 A、体现了马克思列宁主义的基本原理 B、包含了中国共产党人的实践经验 C、揭示了中国革命的特殊规律 D、包含了中华民族的优秀思想 正确答案:ABD 我的答案:AB 得分:8.4分 1.2.毛泽东主义的科学内涵和形成条件 1 在毛泽东思想活的灵魂的几个基本方面中,最具特色、最根本的原则是 A、实事求是 B、群众路线 C、理论联系实际 D、独立自主 正确答案:A 我的答案:A 得分:20.0分 2 下面关于毛泽东思想的论述不正确的是pA、毛泽东思想是毛泽东同志个人正确思想的结晶 B、毛泽东思想是马克思主义中国化第一次历史性飞跃的理论成果 C、毛泽东思想是中国革命和建设的科学指南 D、毛泽东思想是中国共产党和中国人民宝贵的精神财富 正确答案:A 我的答案:A 得分:20.0分 3 毛泽东思想的核心和精髓是 A、武装斗争 B、统一战线 C、党的建设 D、实事求是 正确答案:D 我的答案:D 得分:20.0分 4 毛泽东思想形成的标志是 A、实事求是 B、遵义会议 第1章统计和统计数据 指出下面的变量类型。(1)年龄。(2)性别。(3)汽车产量。 (4)员工对企业某项改革措施的态度(赞成、中立、反对)。(5)购买商品时的支付方式(现金、信用卡、支票)。详细答案:(1)数值变量。(2)分类变量。(3)数值变量。(4)顺序变量。(5)分类变量。 一家研究机构从IT从业者中随机抽取1000人作为样本进行调查,其中60%回答他们的月收入在5000元以上,50%的人回答他们的消费支付方式是用信用卡。 (1)这一研究的总体是什么样本是什么样本量是多少(2)“月收入”是分类变量、顺序变量还是数值变量(3)“消费支付方式”是分类变量、顺序变量还是数值变量详细答案:(1)总体是“所有IT从业者”,样本是“所抽取的1000名IT从业者”,样本量是1000。(2)数值变量。 (3)分类变量。 一项调查表明,消费者每月在网上购物的平均花费是200元,他们选择在网上购物的主要原因是“价格便宜”。 (1)这一研究的总体是什么 (2)“消费者在网上购物的原因”是分类变量、顺序变量还是数值变量详细答案: (1)总体是“所有的网上购物者”。(2)分类变量。 某大学的商学院为了解毕业生的就业倾向,分别在会计专业抽取50人、市场营销专业抽取30、企业管理20人进行调查。 (1)这种抽样方式是分层抽样、系统抽样还是整群抽样(2)样本量是多少详细答案:(1)分层抽样。(2)100。 第3章用统计量描述数据 排队方式各随机抽取9名顾客,得到第一种排队方式的平均等待时间为分钟,标准差为分钟,第二种排队方式的等待时间(单位:分钟)如下: (1)计算第二种排队时间的平均数和标准差。 (2)比两种排队方式等待时间的离散程度。 (3)如果让你选择一种排队方式,你会选择哪一种试说明理由。 详细答案: (1)(岁);(岁)。 (2);。第一中排队方式的离散程度大。 (3)选方法二,因为平均等待时间短,且离散程度小。 在某地区随机抽取120家企业,按利润额进行分组后结果如下:按利润额分组(万元)企业数(个) 300以下19 300~40030 400~50042 500~60018 600以上11 合计120 计算120家企业利润额的平均数和标准差(注:第一组和最后一组的组距按相邻组计算)。 详细答案: =(万元);(万元)。 一、 The manager of the customer service division of a major consumer electronics company is interested in determining whether the customers who have purchased a videocassette recorder made by the company over the past 12 months are satisfied with their products. 1., the population of interest is a)all the customers who have bought a videocassette recorder made by the company over the past 12 months. b)all the customers who have bought a videocassette recorder made by the company and brought it in for repair over the past 12 months. c)all the customers who have used a videocassette recorder over the past 12 months. d)all the customers who have ever bought a videocassette recorder made by the company. ANSWER: a 2., which of the following will be a good frame for drawing a sample a)Telephone directory. b)Voting registry. c)The list of customers who returned the registration card. d) A list of potential customers purchased from a database marketing company. ANSWER: c 3.the possible responses to the question "How many videocassette recorders made by other manufacturers have you used" are values from a 第一章习题参考答案 一、填空题 1、对象事件驱动 2、编译运行模式解释运行模式 二、简答题 1、简述VB的特点。 答:①可视化的程序设计方法 ②面向对象的程序设计思想 ③事件驱动的编程机制 ④结构化的程序设计语言 ⑤高度的可扩充性 ⑥强大的数据库访问能力 ⑦支持动态数据交换 ⑧支持对象链接与嵌入 2、简述VB的安装过程。 答:①向光驱中放入VB安装光盘; ②计算机将运行自动安装程序,若没有,执行VB目录下的Setup.exe; ③根据提示逐一回答问题,并点击“下一步”; ④点击“完成”; 2、如何启动VB。 答:三种方法: ①单击“开始”按钮,选择“程序”菜单下的“Microsoft Visual Basic 6.0 中文版”菜单项并单击; ②双击桌面上的VB6.0快捷图标; ③在“开始”菜单的运行对话框中输入命令来启动VB; 第二章习题参考答案 一、选择题: 1-10、DCACD BCBBC 11-20、BADCA BBAAB 21-29、AACBB CDDC 二、填空题 1.窗体、控件 2.属性值 3.属性窗口设置、代码窗口设置 4.事件过程 5.对象名、下划线、事件名 6. Form_Click 第三章习题参考答案 一、选择题 1、B 2、C 3、A 4、B 5、A 6、C 7、C 二、填空题 1、 11 字符型、字节型、整型、长整型、单精度型、双精度型、货币型、逻辑型、日期型、对象型、变体型。String、Byte、Integer、Long、Single、Double、Currency、Boolean 、Date、Object、Variant 2、双引号(英文)、# 3、 ASCII、1、2 4、 public、通用、Dim、Static、Private、Static 5、 &、+、+ 6、 Now()、Time、日期型 三、解答题 1、(3) 2、(1 ) 3、(1)常量(关键字)(2)字符型常量(3)逻辑型常量(4)变量(5)字符串常量(6)变量 (7)字符串常量(8)变量(9)日期型常量(题目应是#11/16/1999#)(10)数值型常量(单精度) 4、31 5、(1)(1+y/x)/(1-y/x) (2)x^3+3*x*y/(2-y) (3)sqr(abs(a*b-c^3)) (4)sqr(s*(s-a)*(s-b)*(s-c)) 6、 7、(1)13 (2)17 (3)#1999-11-12# (4)zxy123ABC 8、(1)19 (2)8.16666666666667 (3)5.25 (4)2 9、(1)-4 (2)2 . 82842712474619 (3)-3 (4)49 (5)”hello”(6)He 7)16 (8)“-459.65”(9)5 10、(4) 11、(2) 12、(4) 第四章习题参考答案 一、选择题: 1—7: DAABBCD 二、填空题 1. 500.00% 2.将字号扩大为原来的二倍 3. B 三、编程题(略) 1.文本框、标签和命令按钮的名称分别为text1、label1、command1 Private Sub Command1_Click() Label1.caption=text1.text Command1.caption=text1.text End Sub 1、20世纪70年代,人们就已发现,高达50%的疾病或死亡因素与什么有关? 行为及不健康的生活方式 2哪一年在上海成立的精武体育会是当时影响最大,传播最广,维持时间最长的武术组织?1910 3.网球比赛的第一原则是什么? 增加进攻(这个不确定,是根据网球老师说的选的) 4. 网球比赛中要赢得一局比赛,必须比对手多赢几分才可以? 2分 5. 联合国报告认为什么将会是21世纪最严重的健康问题? 体质下降 6. 国际羽联在哪一年正式恢复了我国的合法席位后,开始了我国羽毛球运动的鼎盛时期。1981 7. 哪一个季节人体脂肪合成速度最快? 冬天 8. 哪一年被世界公认为现代足球的诞生日? 1863 9. 下列哪位运动员是新中国历史上第一个获得世界锦标赛冠军的运动员? 容国团 10.在哪届奥运会上,乒乓球成为正式比赛项目? 汉城奥运会 11.篮球规则规定,篮圈离地垂直高度为多少? 3.05米 12. 1895年,由美国人()发明了排球运动。 威廉·G·摩根 13,。有助于提高肌肉力量的训练方法有哪些? 卧推 14.下列不易于发展柔韧素质的练习时段或状态有哪些?(这个也不清楚,是看它字体颜色不一样)身体极其疲惫 15.20世纪50年代末期,巴西人创造了哪种阵型被誉为足球史上的第二次变革。 “四二四”阵形 16.曾经在NBA总决赛中受伤,坚持参加比赛最后获得冠军并取得最有价值称号的凯尔特人球星是()? 保罗皮尔斯 17.体育锻炼与传统心理治疗手段同样具有抗抑郁效能,是治疗抑郁症的()手段;体育锻炼治疗抗抑郁症的效果与药物相比比较()。 辅助;持久 18.在运动中不慎扭伤,下列做法不正确的是() 马上揉搓患处 19.20XX年伦敦奥运会羽毛球囊括多少枚金牌? 5 20.“让参与者成为享受运动,实现人生潜能的一代”是哪一个健康促进的愿景? 为动而生 21.减小肚皮应采用哪一类运动? 长时间低强度 22.棍多以抡、劈、扫、云等法为主,大多是横方向用力,动作幅度较大,其特点:一招一式虎虎生威,动如疾风骤雨,产生"棍打一大片"的效果。棍被称为() 百兵之首 23.作为当下盛行的舞蹈元素,以人体中段(腰、腹、臀部)的各种动作为主,具有阿拉伯风情的舞蹈形式是()。肚皮舞 288 Chapter 8: Confidence Interval Estimation CHAPTER 8 8.1 X ±Z ?σ n = 85±1.96? 864 83.04 ≤μ≤ 86.96 8.2 X ±Z ? σ n = 125±2.58?24 36 114.68 ≤μ≤ 135.32 8.3 If all possible samples of the same size n are taken, 95% of them include the true population average monthly sales of the product within the interval developed. Thus you are 95 percent confident that this sample is one that does correctly estimate the true average amount. 8.4 Since the results of only one sample are used to indicate whether something has gone wrong in the production process, the manufacturer can never know with 100% certainty that the specific interval obtained from the sample includes the true population mean. In order to have 100% confidence, the entire population (sample size N ) would have to be selected. 8.5 To the extent that the sampling distribution of sample means is approximately normal, it is true that approximately 95% of all possible sample means taken from samples of that same size will fall within 1.96 times the standard error away from the true population mean. But the population mean is not known with certainty. Since the manufacturer estimated the mean would fall between 10.99408 and 11.00192 inches based on a single sample, it is not necessarily true that 95% of all sample means will fall within those same bounds. 8.6 Approximately 5% of the intervals will not include the true population. Since the true population mean is not known, we do not know for certain whether it is contained in the interval (between 10.99408 and 11.00192 inches) that we have developed. 8.7 (a) X ±Z ?σ n =0.995±2.58? 0.02 50 0.9877≤μ≤1.0023 (b) Since the value of 1.0 is included in the interval, there is no reason to believe that the mean is different from 1.0 gallon. (c) No. Since σ is known and n = 50, from the Central Limit Theorem, we may assume that the sampling distribution of X is approximately normal. (d) The reduced confidence level narrows the width of the confidence interval. X ±Z ? σ n =0.995±1.96? 0.02 50 0.9895≤μ≤1.0005 (b) Since the value of 1.0 is still included in the interval, there is no reason to believe that the mean is different from 1.0 gallon. 《统计分析与SPSS的应用(第五版)》(薛薇) 课后练习答案 第8章SPSS的相关分析 1、对15家商业企业进行客户满意度调查,同时聘请相关专家对这15家企业的综合竞争力进行评分,结果如下表。 编号客户满意度得分综合竞争力得分编号客户满意度得分综合竞争力得分 1 90 70 9 10 60 2 100 80 10 20 30 3 150 150 11 80 100 4 130 140 12 70 110 5 120 90 13 30 10 6 110 120 14 50 40 7 40 20 15 60 50 8 140 130 请问,这些数据能否说明企业的客户满意度与其综合竞争力存在较强的正相关,为什么? 能。步骤:(1)图形旧对话框散点/点状简单分布进行相应设置确定;(2)再双击图形元素总计拟合线拟合线线性确定 (3)分析相关双变量进行相关项设置确定 相关性 客户满意度得分综合竞争力得分 ** 客户满意度得分Pearson 相关性 1 .864 显著性(双尾).000 N 16 15 综合竞争力得分Pearson 相关性.864 ** 1 显著性(双尾).000 N 15 15 **. 在置信度(双测)为0.01 时,相关性是显著的。 两者的简单相关系数为0.864,说明存在正的强相关性。 2、为研究香烟消耗量与肺癌死亡率的关系,收集下表数据。(说明:1930年左右几乎极少的妇女吸烟;采用1950年的肺癌死亡率是考虑到吸烟的效果需要一段时间才可显现)。 国家1930 年人均香烟消耗量1950 年每百万男子中死于肺癌的人数 澳大利亚480 180 加拿大500 150 丹麦380 170 芬兰1100 350 英国1100 460 荷兰490 240 冰岛230 60 挪威250 90 瑞典300 110 瑞士510 250 美国1300 200 绘制上述数据的散点图,并计算相关系数,说明香烟消耗量与肺癌死亡率之间是否存在显 著的相关关系。 香烟消耗量与肺癌死亡率的散点图(操作方法与第 1 题相同) 相关性 人均香烟消耗死于肺癌人数 ** 人均香烟消耗Pearson 相关性 1 .737 显著性(双尾).010 N 11 11 死于肺癌人数Pearson 相关性.737 ** 1 3.3 某百货公司连续40天的商品销售额如下: 单位:万元 41 25 29 47 38 34 30 38 43 40 46 36 45 37 37 36 45 43 33 44 35 28 46 34 30 37 44 26 38 44 42 36 37 37 49 39 42 32 36 35 要求:根据上面的数据进行适当的分组,编制频数分布表,并绘制直方图。 1、确定组数: ()l g 40l g () 1.60206 111 6.32l g (2)l g 20.30103 n K =+ =+=+=,取k=6 2、确定组距: 组距=( 最大值 - 最小值)÷ 组数=(49-25)÷6=4,取5 3、分组频数表 销售收入(万元) 频数 频率% 累计频数 累计频率% <= 25 1 2.5 1 2.5 26 - 30 5 12.5 6 15.0 31 - 35 6 15.0 12 30.0 36 - 40 14 35.0 26 65.0 41 - 45 10 25.0 36 90.0 46+ 4 10.0 40 100.0 总和 40 100.0 频数 246810121416<= 25 26 - 30 31 - 35 36 - 40 41 - 45 46+ 销售收入 频数 频数 3.9.下面是某考试管理中心对2002年参加成人自学考试的12000名学生的年龄分组数据: 年龄 18~19 21~21 22~24 25~29 30~34 35~39 40~44 45~59 % 1.9 34.7 34.1 17.2 6.4 2.7 1.8 1.2 (1) 对这个年龄分布作直方图; (2) 从直方图分析成人自学考试人员年龄分布的特点。 解:(1)制作直方图:将上表复制到Excel 表中,点击:图表向导→柱形图→选择子图表类型→完成。即得到如下的直方图:(见Excel 练习题2.6) VB课后练习答案P12第一章课后练习答案: 一、选择题 二、填空题 第二章(P39) 选择题答案: 填空题答案: 1.Cmdl, Click 2.Text 1.Text二"Hello" P64第三章课后练习答案一、选择题 二、填空题 1. (Y Mod 4=0 And Y Mod 10000) Or Y Mod 400=0 2. a<>0 And b*2-4*a*c>=0 3. X Mod 5=0 And X Mod 2=0 或 Tnt(x/5)=X/5 And Int(X/2)=X/2 4. 注意:返回的均是字符型。 第四章课后答案:P79 一、选择题 答案为:$$41.500 10 二、填空题 三、程序设计题(提示) 1、鸡的头数为x,兔的头数为y,则可列方程式: \x-\- y = h (兀 * 2 + y * 4 =于 求得x, y 的值再在窗体上输出结果。 2、 利用Format 格式函数,再通过窗体的Print 将格式化后的信息输出到窗体上。 3、 厶员I 的周长=2加" $岡的面积=加2 5、通过Inputbox 函数或用文本框输入三边和圆的半径 a,b,c, r,利用公式: . a + b + c n 二 --------- 2 S 三角形面积=Jh (h - - b )(h - c ) P97第五章课后练习答案: 第9题| D 一、选择题 答案D 改为:30 二、填空题 第]题Y Mod 4二0 And Y Mod 100二0 Or Y Mod 400二0 第2题 笫3题 笫4题 Private Sub Command l_Click() X=Val(Textl.Text) Select Case X Case Is>200. Isv-10() Print “xv 100 Or x>200" Case ls<=0 Y=l()()-X Case Isv二100 Y=100+X Case Is<=200 Y=400 End Select Text2.Text=y End Sub 三、程序设计题(提示) 1、判断条件: 假设一个整数为x X Mod 3=0 Or x Mod 5=0 或x/3=x\3 Or x/5=x\5 2、选项按钮的知识点在P182,利用该控件的Wlue属性判断是否选中该项。 第六章课后题参考答案 、选择题 l.D 2.D 3.C 4.B 5.C 6.B 7.C &A 9.C 10. D ll.B 12.D 二、填空题 1 .Male*4+Female*3+Boy/2=36 2.M T M<=39 3.-C 1+1 I<=N统计学课后练习题答案人大第四版
商务统计学Assignment 2 (附答案)
VB第一章课后习题答案
统计学课后题答案第四版中国人民大学出版社
商务统计学笔试复习题
visual_Basic程序的设计教程_课后习题答案及练习
最全毛概慕课课后题答案
统计学第四版答案(贾俊平)
商务统计学笔试复习题
VB课后答案(第四版)蒋加伏、张林峰
体育慕课考试答案
商务统计学(第四版)课后习题答案第八章
《统计分析与SPSS的应用(第五版)》课后练习答案(第8章)
统计学贾俊平_第四版课后习题答案 2
VB课后练习答案.doc
相关主题
文本预览