Assessing the Effects of Agricultural Change on Nitrogen Fluxes Using the Integrated Nitrogen CAtchment
(INCA) Model
Katri Rankinen a, Heikki Lehtonen b, Kirsti Granlund a and Ilona B?rlund a
a Finnish Environment Institute, P.O.Box 140, FIN-00251 Helsinki, Finland
e-mail: katri.rankinen@ymparisto.fi
b MTT Economi
c Research, Agrifoo
d Research Finland, Luutnantinti
e 13, FIN-00410 Helsinki, Finland
Abstract: The INCA (Integrated Nitrogen CAtchment) model is a semi-distributed, dynamic nitrogen model which simulates nitrogen fluxes in catchments. Sources of nitrogen can be atmospheric deposition, the terres-trial environment or direct discharges. The model can simulate nitrogen processes in six land use classes. There are three components included; the hydrological model, the catchment nitrogen process model and the river nitrogen process model. The aim of this study is to compare the effects of three different agricultural policy scenarios on inorganic nitrogen flux to the sea from Finnish catchments. Target years of these scenar-ios are 2010 and 2020. The changes in agricultural production in different scenarios of agricultural policy are evaluated using the DREMFIA model (Dynamic Regional Model of Finnish Agriculture). DREMFIA is a dynamic dis-equilibrium model based on an evolutionary scheme of technology diffusion which considers farm investments, evolving farm size structure and technological change explicitly. In the first phase of the study the INCA model is applied to the Simojoki river basin in northern Finland, where main anthropogenic influences are agriculture, atmospheric deposition and forestry. At the Simojoki river basin agriculture is mainly animal husbandry and grass cultivation. The river Simojoki discharges to the Bothnian Bay. The predicted changes in agricultural production and land use at Simojoki river basin prove to have more effect on inorganic nitrogen flux to the sea than changes in forestry practices or atmospheric deposition. This result stems from the specific location, ecosystem type and characteristics of farm land in Simojoki basin. Next the INCA model will be applied to a river basin in southern Finland, where the main land use form is agriculture.
Keywords: Agricultural policy scenarios; Agricultural sector modelling; Semi-distributed modelling; N leaching; Northern river basin
1. INTRODUCTION
Eutrophication of surface waters due to increased nutrient loading during the last decades is one of the main environmental concerns in Finland. Agri-culture comprises the largest single source of nu-trients to surface waters. Municipal and industrial waste water purification has effectively decreased nutrient load from point sources leading to im-proved water quality, but no clear effects of de-creasing non-point loading are found [R?ike et al. 2003].
There is agriculture all over the Finland despite of the northern location of the country, though main production areas are in southern and western parts of the country. Finnish agricultural products come mainly from family farms. The location of the different production lines and use of arable land are dictated by the climatic conditions. Most of the crop production is in the south whereas cattle breeding is concentrated in central, eastern and northern parts.
Since 1995, the Finnish agricultural support meas-ures have been based on the Common Agricultural Policy (CAP) of the EU. There are three kind of agricultural supports in Finland. CAP supports for arable crops and animals are closely linked to the market arrangements of the CAP, and these are
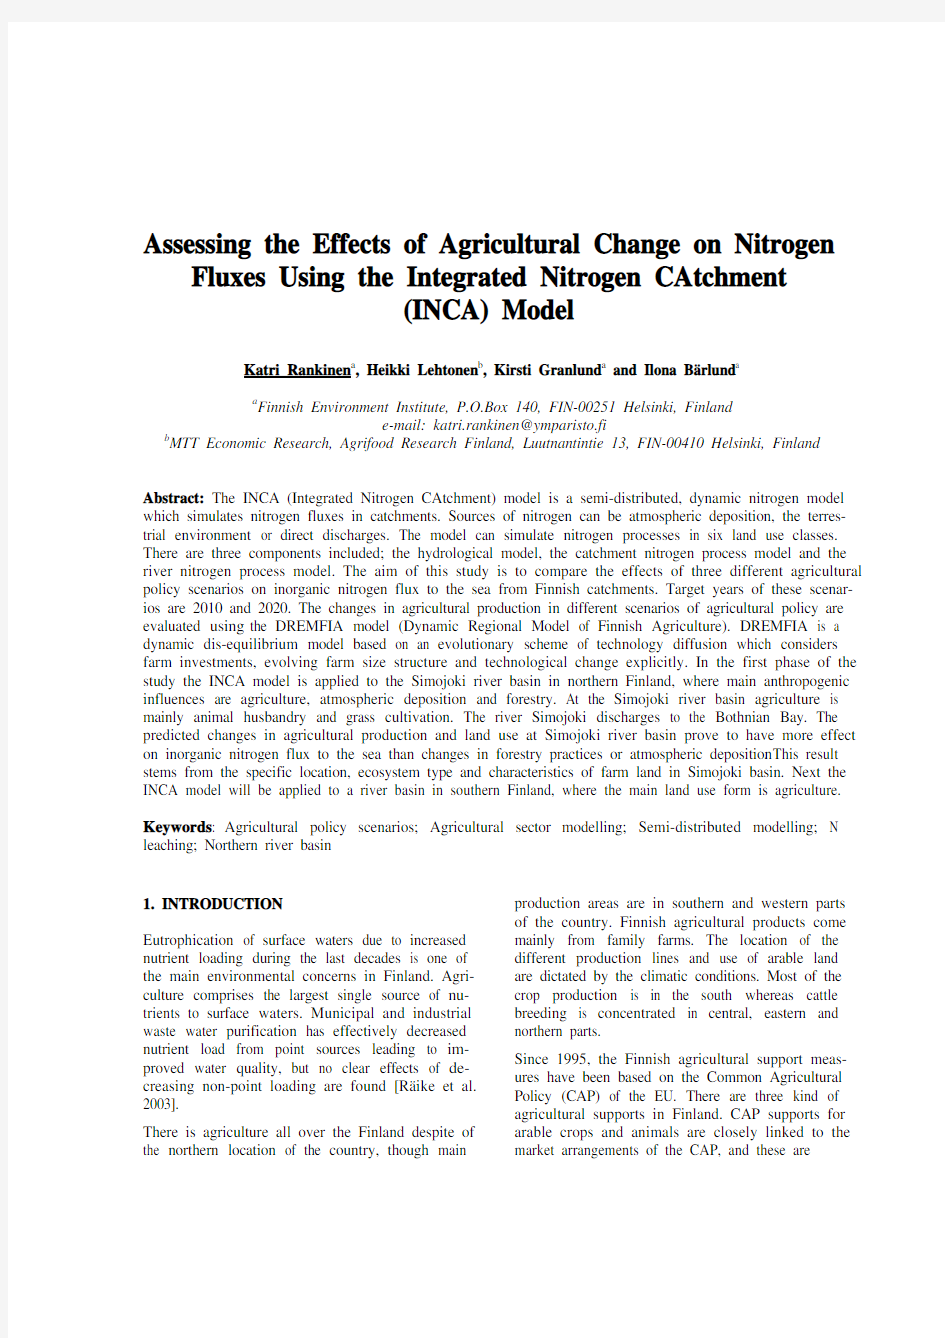
Figure 1. Location of the Simojoki river basin in northern Finland
financed in full from the EU budget. In 2003 these accounted for 26% of all agricultural support. The share of support for rural development co-financed by Finland and the EU was 41%. National aid accounted for 34%.
Typically different mathematical models and deci-sion support systems are used for evaluating policy measures like EU's Agenda 2000 reform [e.g. Wier et al. 2002, Pacini et al. 2004]. Forsman et al. [2003] described a generic framework in which economical models can be linked with N transport and transformation models at different scales. Their principles are followed in this study when linking an agricultural policy model to a catchment scale N model. A physical plot scale model would give more detailed information of N processes but is more problematic to be applied on a catchment scale. Also, Quinn [2004] argued that a complex physical model is not needed when studying nitrate pollution problem at the catchment scale.
The aim of this study is to compare the effects of agricultural policy scenarios on inorganic nitrogen (N) flux to the sea from a Finnish catchment. The changes in agricultural production in different scenarios of agricultural policy are evaluated using the DREMFIA model (Dynamic Regional Model of Finnish Agriculture) [Lehtonen 2001]. The effects of agricultural production scenarios on inorganic N processes are simulated by the dy-namic, semi-distributed INCA model (Integrated Nitrogen in CAtchments) [Wade et al. 2002, Whitehead et al. 1998]. The Finnish Agri-Environmental Progamme (FAEP) interview re-search of the farmers is used to derive typical cul-tivation practices [Palva et al. 2001]. In this first phase of the study these models are applied to the Simojoki river basin in northern Finland. Agricultural fields cover less than 3% of the total area, and agricultural production is mainly grass cultivation for animal production. Influences of changes in agricultural production on N leach-ing were compared with influences of changes in atmospheric deposition and forestry practices which were previously evaluated by Rankinen et al. [2004]. In the next phase of the study the INCA model will be applied to a river basin in southern Finland, where the main land use form is agricul-ture and production lines are more variable.
2. MATERIALS AND METHODS
2.1 The Simojoki river basin
The Simojoki river basin (3160 km2) can be subdi-vided into nine sub-basins (Fig. 1.). Over the pe-riod 1961-1975, annual precipitation varied be-tween 650-750 mm and annual runoff between 350-450. The mean annual temperature is +0.5 - +1.5 o C. The duration of the snow cover is from the middle of November to early May. According to the Finnish Meteorological Institute growing season started on an average on 10th May in years 1961-1990. Length of the growing season was on average 140 days.
The river Simojoki is a salmon river in near-natural state, and the dominant human impacts in the area are forestry, agriculture and atmospheric deposition. An average 0.5% of the total catchment area is felled annually. In 1995 there were 1365 ha of peat mining area (0.43% of the catchment area). Urban areas cover only 0.06% and agricultural
fields 2.7% of the catchment area [Perkki? et al. 1995]. Grass cultivation for animal husbandry is the most common form of agricultural production.
2.2 The DREMFIA model
The changes in agricultural production are evalu-ated by the Dynamic Regional Model of Finnish Agriculture [Lehtonen 2001, 2004]. DREMFIA is a dynamic dis-equilibrium model based on an evolutionary scheme of technology diffusion which considers farm investments explicitly. The model can be used to evaluate the effects of differ-ent agricultural policies both on production and on agricultural income. Agriculture in the Simojoki river basin is modelled as one region in DREMFIA model which covers 17 other agricultural regions in Finland.
The core of the model is an optimisation block which maximises the producer and consumer sur-plus. Endogenous investments determine animal and crop production volume in the long-term, but short-term changes in crop production are con-strained by flexibility constraints. The constraints are validated on the basis of average crop produc-tion data from 1990-2002. Changing agricultural policy and consumption trends are given exoge-nously. All foreign trade flows are assumed to and from the EU (Armington assumption is used). Fertilization and yield levels are dependent on crop and fertilizer prices. Feeding of animals may change due to production and animal nutrition requirements. The average milk yield depends on feedstuffs used in feeding. Thus, the price of milk and feedstuffs affect the nitrogen fertilization level and milk yield of dairy cows. The model is vali-dated to observed production levels in 1995-2002. In this study the scenarios of agricultural policy are based on Agenda 2000 agreement of CAP. Base (BASE) scenario follows Agenda 2000 reform which is assumed to stay unchanged up to 2020. National support, investment support and envi-ronmental support are assumed to stay at the level in which they were in year 2002. Prices of dairy products as well as the producer price of milk is assumed to fall (<15%) following the cuts in the EU intervention prices of butter and skimmed milk powder. In Mid Term Review (MTR) sce-nario quota system for milk is assumed to stay, but producer price in the EU is assumed to decrease by 16% by the year 2007. 75% of bull premium and 100% of suckler cow premium remain coupled to production, but all other CAP payments are de-coupled.Other supports are assumed to stay at present level. 2.2 The INCA model
The effects of changing agricultural land use on inorganic N flux to the Bothnian Bay are evaluated by the Integrated Nitrogen in Catchments model [Whitehead et al. 1998, Wade et al. 2002]. This model integrates hydrology, catchment and river N processes, and simulates daily NO3-N and NH4-N concentrations as time series at key sites, as pro-files down the river system or as statistical distri-butions. The term semi-distributed is used, as it is not intended to model catchment land surface in a detailed manner, but to use a land-use class in a sub-basin as a basic modelling unit. Sources of nitrogen include atmospheric deposition, the ter-restrial environment and direct discharges.
The land use hydrological model is a daily mass balance such that daily water flows are computed for soil, groundwater and leaching to the river for up to six land use classes. The river flow model is based on mass balance of flow and uses a multi-reach description of the river system. Within each reach flow variation is determined by a non-linear reservoir model.
The key N processes in terrestrial environment are nitrification, denitrification, mineralization, immo-bilisation, N fixation and plant uptake for inor-ganic N. Rate coefficients of N processes are tem-perature and moisture dependent. In the river the key processes are denitrification of NO3 and nitri-fication of NH4.
At the Simojoki river basin the six land-use classes are: forest on mineral soil (35% of the area), cut forest on mineral soil (4%), forest on organic soil (52%), cut forest on organic soil (1%), agriculture (2%) and open surface water (6%). Forest cut areas are parameterised as set-aside lands where ground vegetation is recovered. In this calibration net mineralization as difference between gross miner-alisation and immobilisation is used. Parameterisa-tion is otherwise described in Rankinen et al. [2004], but description of agricultural fields is improved.
All the farmers are assumed to follow the same typical cultivation practices which are derived from the FAEP interview research [Palva et al. 2001]. All the fields are under perennial grass ley which is assumed to be harvested on 23rd June and on 15th August. Two growth periods are simulated by using the Multiple Growth Period option in the INCA model. Agricultural fields are fertilized at 30th May and second time at 28th June. Maximum fertilization levels either for mineral or organic fertilizers (Table 1.) are based on the recom-mended fertilization according to the Agri-Environmental Support Scheme (basic measures) and the FAEP interview research.
Table 1. Used max. N fertilization either for min-eral fertilizers or for organic fertilizers
1. fertilization
2. fertilization Mineral
NH4-N 70 kg ha-130 kg ha-1 NO3-N 30 kg ha-124 kg ha-1 Organic
Soluble N 105 kg ha-160 kg ha-1 Fertilization is given to the INCA model as time series in which half of the fertilization is assumed to be organic and half mineral. Mineral fertilizers are dissolved at rate 0.15 day-1. Soluble N of or-ganic fertilizers is assumed to be NH4-N, which rapidly nitrifies in soil. Both NH4-N and NO3-N pools are dissolved at rate 0.15 day-1. Long-term effect of organic fertilizers on soil fertility is taken into account by allowing a high mineralization rate from the soil organic N pool. N process parameters for land use class Agricultural fields are presented in Table 2.
Table 2.Parameter values for N processes at the land use class Agricultural fields
Process Value Unit Mineralisation 1.2 kg ha-1 day-1 Nitrification 0.2 day-1 Denitrification 0.015 day-1 Growth season start day 136 -
Growth period 120 days Nitrate uptake rate 0.25 day-1 Ammonium uptake rate 0.2 day-1 Maximum N uptake 250 kg N yr-1 ha-1
3. RESULTS AND DISCUSSION
3.1 Assessed changes in agricultural practises The output of the DREMFIA model includes year-to-year variation in the total area of agricultural land as well as in the area of main crops and the fertilization levels. The total area of agricultural land is limited by the area of suitable soil types for agriculture.
Grass cultivation stays as the main production form at the Simojoki river basin (Fig. 2). In BASE-scenario the total area of agricultural land in-creases by 25% by the year 2010 and then starts slowly to decrease. In MTR-scenario the total area of agricultural land increases by 35% by the year 2010 and then levels off. In reality the utilised agricultural area has increased by 11% in northern Finland in 1996-2003.
After the year 2010 the milk production volume and the area of grass cultivation starts to decrease and the area of green fallow to increase. This is because decreasing milk price and de-coupled payments decrease dairy investments. Fertilization levels including nitrogen from manure are pre-sented in Table 3.
use
Table 3. Simulated fertilization levels for grass
BASE MTR
1995 160 kg N ha-1160 kg N ha-1 2010 151 kg N ha-1143 kg N ha-1 2020 153 kg N ha-1151 kg N ha-1
3.2 Effect of agricultural policy on N leaching
In the INCA model simulations meteorological data from years 1994-1996 is used. Observed and simulated discharge and inorganic N concentra-tions at the river Simojoki outlet in years 1994-1996 are presented in Figure 3. These years are used as a base-line for scenarios when evaluating inorganic N leaching.
Total area of cultivated land, main crop types and fertilization levels simulated by the DREMFIA model are used as input to the INCA model. Changes in parameterised land use types happen
river
between agricultural fields and forest on mineral soil when area of agricultural fields increases. Green fallow is simulated as unfertilized set-aside land (forest cut on mineral soil).
In BASE scenario the total area of agricultural land increases by 9% by the year 2020 from 1995 and grass stays as main crop but that change is not enough to increase total inorganic N flux to the sea. In MTR scenario the total area of utilised agricultural fields increases by 35%, but the share of green fallow increases at the expense of grass cultivation which leads decreasing inorganic N flux to the sea by 2.5%. Inorganic N fluxes to the sea are highest in the year 2010 when the total area of both agricultural land and grass cultivation is largest.
The scenarios of forestry and atmospheric deposi-tion [Rankinen et al. 2004] were compared to the scenarios of agriculture. Forest cut areas are as-sumed to increase by 20% (Cut+20 scenario) and deposition level is assumed to decrease from 2.3 kg N ha-1yr-1 to 2 kg N ha-1yr-1. In Cut-100_NoPeat scenario no forest cut areas and no peat mining is assumed. In Figure 4. the effects of different scenarios on N flux to the sea in the year 2010 were compared.
Even though the total area of agricultural land at the Simojoki river basin is only a couple of per-cents, changes in it has more pronounced effect on inorganic N flux than changes in forestry practices or atmospheric N deposition. Inorganic N load is typically about ten times higher from cultivated fields than from forests. Expected changes in at-mospheric N deposition are very low and forest cut areas are assumed to represent situation several years after treatment when disturbance is abated. Direct and local effects of forest cut may be more extensive. Forest cut areas are located mainly in uppermost areas of the river basin, so inorganic N may be denitrified in river water before it reaches the outlet of the river. Agricultural fields on the other hand are mainly located on river deposits along the river near outlet.
Figure 4. Changes in inorganic N flux to the Bothnian Bay according to different scenarios in
2010
-10.0-5.00.0 5.010.0
%
4. CONCLUSIONS
This study shows that changes in agricultural pro-duction volume and production practises derived from the DREMFIA model can be combined with the INCA model to evaluate inorganic N flux from terrestrial areas to surface waters. With the catch-ment scale INCA model the effects of changes in agricultural production can be compared to the effects of other changes in the river basin. When including evaluation of environmental goals and social and economic impacts this approach can be expanded to fulfil the whole generic structure of a decision support system described by Forsman et al. [2003].
Assessed changes in agricultural land use in the Simojoki river basin can alter the inorganic N flux to the sea up to 5%. Agricultural activities at this northern river basin, which is considered less fa-vourable production area, are clearly policy driven. Any significant reduction in milk price and de-coupling of agricultural support from production is likely to decrease the intensity and scale of produc-tion. These are contradictory to the results of Win-ter and Gaskell [1998] and Weir et al. [2002] who did not find any significant environmental effect of the Agenda 2000 CAP reform in Great Britain and Denmark.
The next step is to continue this study by applying the models to a catchment in southern Finland where the main land use form is agriculture and the agricultural production lines are more variable.
5. ACKNOWLEDGEMENTS
This study was supported by the Commission of the European Union, the INCA project (EVK1-CT-1999-00011). The financial support of the SUSAGFU project (contract 76724) and NU-TRIBA project (contract 202421) through the Academy of Finland is gratefully acknowledged.
6. REFERENCES
CEC, http://europa.eu.int/comm/
agriculture/ mtr/index_en.htm, 2003. Forsman, ?., A. Grimvall, J. Scholtes and H.B. Wittgren, Generic structures of decision support systems for evaluation of policy measures to re-duce catchment-scale nitrogen fluxes, Physics and Chemistry of the Earth, 28, 589-598, 2003 Lehtonen, H., Principles, structure and application of dynamic regional sector model of Finnish ag-riculture. PhD thesis, Systems Analysis Labora-tory, Helsinki University of Technology. Agri-
food Research Finland, Economic Research (MTTL) Publ. 98. Helsinki, 2001. Lehtonen, H., Impacts of de-coupling agricultural support on dairy investments and milk produc-tion volume in Finland. Forthcoming in Acta Agriculturae Scandinavica, Section C: Food Economics, 2004.
Pacini, C., G. Giesen, A. Wossink, L. Omodei-Zorini and R. Huirne, The EU's Agenda 2000 reform and the sustainability of organic farming in Tuscany: ecological-economic modelling at field and farm level, Agricultural Systems 80, 171-197, 2004.
Palva, R., K. Rankinen, K. Granlund, J. Gr?nroos, A. Nikander and S. Rekolainen, Maatalouden ymp?rist?tuen toimenpiteiden toteutuminen ja vaikutukset vesist?kuormitukseen vuosina 1995-1999. MYTVAS-projektin loppuraportti. Suomen ymp?rist?. Ymp?rist?nsuojelu. pp 92. 2001
Perkki?, S., E. Huttula and M. Nenonen, Simojoen vesist?n vesiensuojelusuunnitelma. Vesi- ja ymp?rist?hallinnon julkaisuja-sarja A 200, 1995. Quinn, P. Scale appropriate modelling: represent-ing cause-and-effect relationships in nitrate pol-lution at the catchment scale for the purpose of catchment scale planning, Journal of Hydrology 291, 197-217, 2004.
Rankinen, K., K. Granlund and A. Lepist?, Inte-grated nitrogen and flow modelling (INCA) in a boreal river basin dominated by forestry: scenar-ios of environmental change. Water, Air and Soil Pollution Focus, (Accepted), 2004.
R?ike, A., O.-P. Pietil?inen, S. Rekolainen, P. Kauppila, H. Pitk?nen, J. Niemi, A. Raateland and J. Vuorenmaa, Trends of phosphorus, nitro-gen and clorophyll a concentrations in Finnish rivers and lakes in 1975-2000. the Science of the Total Environment 310, 47-59, 2003.
Wade, A., P. Durand, V. Beaujoan, W. Wessels, K. Raat, P.G. Whitehead, D. Butterfield, K. Rankinen and A. Lepist?, Towards a generic ni-trogen model of European ecosystems: New model structure and equations. Hydrology and Earth System Sciences 6, 559-582, 2002. Whitehead, P.G., E.J. Wilson and D. Butterfield, A semi-distributed Integrated Nitrogen model for multiple source assessment in Catchments (INCA): Part I-model structure and process equations. the Science of the Total Environment 210/211, 547-558, 1998.
Wier, M., J.M. Andersen, J. Jensen and T.C. Jen-sen, The EU's Agenda 2000 reform for the agri-cultural sector: environmental and economic ef-fects in Denmark, Ecologicl Economics 41, 345-359, 2002.
Winter, M. and P. Gaskell, The Agenda 2000 de-bate and CAP reform in Great Britain. Is the en-
vironment being sidelined? Land Use Policy 15, 217-231, 1998.