Development of a Large SNP Genotyping Array and Generation of High-Density Genetic Maps in Tomato
Sung-Chur Sim1,Gregor Durstewitz2,Jo¨rg Plieske2,Ralf Wieseke2,Martin W.Ganal2,Allen Van Deynze3, John P.Hamilton4,C.Robin Buell4,Mathilde Causse5,Saranga Wijeratne6,David M.Francis1*
1Department of Horticulture and Crop Science,Ohio Agricultural Research and Development Center,The Ohio State University,Wooster,Ohio,United States of America, 2TraitGenetics GmbH,Gatersleben,Germany,3Seed Biotechnology Center,University of California Davis,Davis,California,United States of America,4Department of Plant Biology,Michigan State University,East Lansing,Michigan,United States of America,5Institut National de la Recherche Agronomique,INRA,Unite′de Ge′ne′tique et d’Ame′lioration des Fruits et Le′gumes,Montfavet,France,6Molecular Cellular and Imagining Center,Ohio Agricultural Research and Development Center,The Ohio State University,Wooster,Ohio,United States of America
Abstract
The concurrent development of high-throughput genotyping platforms and next generation sequencing(NGS)has increased the number and density of genetic markers,the efficiency of constructing detailed linkage maps,and our ability to overlay recombination and physical maps of the genome.We developed an array for tomato with8,784Single Nucleotide Polymorphisms(SNPs)mainly discovered based on NGS-derived transcriptome sequences.Of the SNPs,7,720 (88%)passed manufacturing quality control and could be scored in tomato germplasm.The array was used to generate high-density linkage maps for three interspecific F2populations:EXPEN2000(Solanum lycopersicum LA0925x S.pennellii LA0716,79individuals),EXPEN2012(S.lycopersicum Moneymaker x S.pennellii LA0716,160individuals),and EXPIM2012(S.
lycopersicum Moneymaker x S.pimpinellifolium LA0121,183individuals).The EXPEN2000-SNP and EXPEN2012maps consisted of3,503and3,687markers representing1,076and1,229unique map positions(genetic bins),respectively.The EXPEN2000-SNP map had an average marker bin interval of1.6cM,while the EXPEN2012map had an average bin interval of0.9cM.The EXPIM2012map was constructed with4,491markers(1,358bins)and an average bin interval of0.8cM.All three linkage maps revealed an uneven distribution of markers across the genome.The dense EXPEN2012and EXPIM2012 maps showed high levels of colinearity across all12chromosomes,and also revealed evidence of small inversions between LA0716and LA0121.Physical positions of7,666SNPs were identified relative to the tomato genome sequence.The genetic and physical positions were mostly consistent.Exceptions were observed for chromosomes3,https://www.doczj.com/doc/5f10271742.html,paring genetic positions relative to physical positions revealed that genomic regions with high recombination rates were consistent with the known distribution of euchromatin across the12chromosomes,while very low recombination rates were observed in the heterochromatic regions.
Citation:Sim S-C,Durstewitz G,Plieske J,Wieseke R,Ganal MW,et al.(2012)Development of a Large SNP Genotyping Array and Generation of High-Density Genetic Maps in Tomato.PLoS ONE7(7):e40563.doi:10.1371/journal.pone.0040563
Editor:Tongming Yin,Nanjing Forestry University,China
Received March8,2012;Accepted June9,2012;Published July10,2012
Copyright:?2012Sim et al.This is an open-access article distributed under the terms of the Creative Commons Attribution License,which permits unrestricted use,distribution,and reproduction in any medium,provided the original author and source are credited.
Funding:This work was supported by a grant from the United States Department of Agriculture/National Institute of Food and Agriculture(USDA/NIFA)(2008-55300-04757and2009-85606-05673).Work at TraitGenetics was supported by the German Federal Ministry of Education and Research(BMBF)through grant number0315639A.INRA SNPs were obtained from the INRA AIP Bioresources and from the ARCAD sub-project‘‘Comparative population genomics’’.ARCAD (Agropolis Resource Center for Crop Conservation,Adaptation and Diversity)is funded(2009–2013)by the Agropolis Fondation,the French foundation for Agricultural Sciences and Sustainable Development(https://www.doczj.com/doc/5f10271742.html, and www.agropolis-fondation.fr).The funders had no role in study design,data collection and analysis,decision to publish,or preparation of the manuscript.
Competing Interests:The authors have the following conflicts:Dr.Durstewitz,Dr.Plieske,Dr.Wieseke,and Dr.Ganal have competing interests as members of TraitGenetics,which is a commercial company that performs molecular marker analysis with the tomato SNP array.TraitGenetics has also a commercial interest in the data generated with the array since it increases the value of their services to their customers.This does not alter the authors’adherence to all the PLoS ONE policies on sharing data and materials.There are no further products in development or marketed products or patents to declare.
*E-mail:francis.77@https://www.doczj.com/doc/5f10271742.html,
Introduction
Tomato(Solanum lycopersicum L.)has been a model species for basic studies in plant biology.The strength of genetic resources anchored to high-density maps has permitted the map-based cloning of genes involved in disease resistance[1–4],plant and fruit development[5,6],and regulation of biochemical processes [7].The first high-density genetic map for tomato consisted of over 1,000restriction fragment length polymorphism(RFLP)markers segregating in an interspecific F2population derived from a wide cross between S.lycopersicum and S.pennellii[8].More recently, mapping studies have focused on polymerase chain reaction (PCR)-based markers with genetic maps of cultivated tomato developed using344Simple Sequence Repeat(SSR)and793 Singe Nucleotide Polymorphism(SNP)markers[9]and integrated S.lycopersicum x S.pimpinellifolium maps based on434PCR-based markers[10].
The genomic resources available for tomato are rapidly expanding due to the increased throughput of next generation sequencing(NGS)technologies that have significantly reduced the cost and time of sequencing relative to the Sanger method and facilitated whole-genome sequencing,transcriptome profiling,and discovery of variation across genomes[11–13].NGS has permitted genome-wide SNP discovery in many crop species including rice
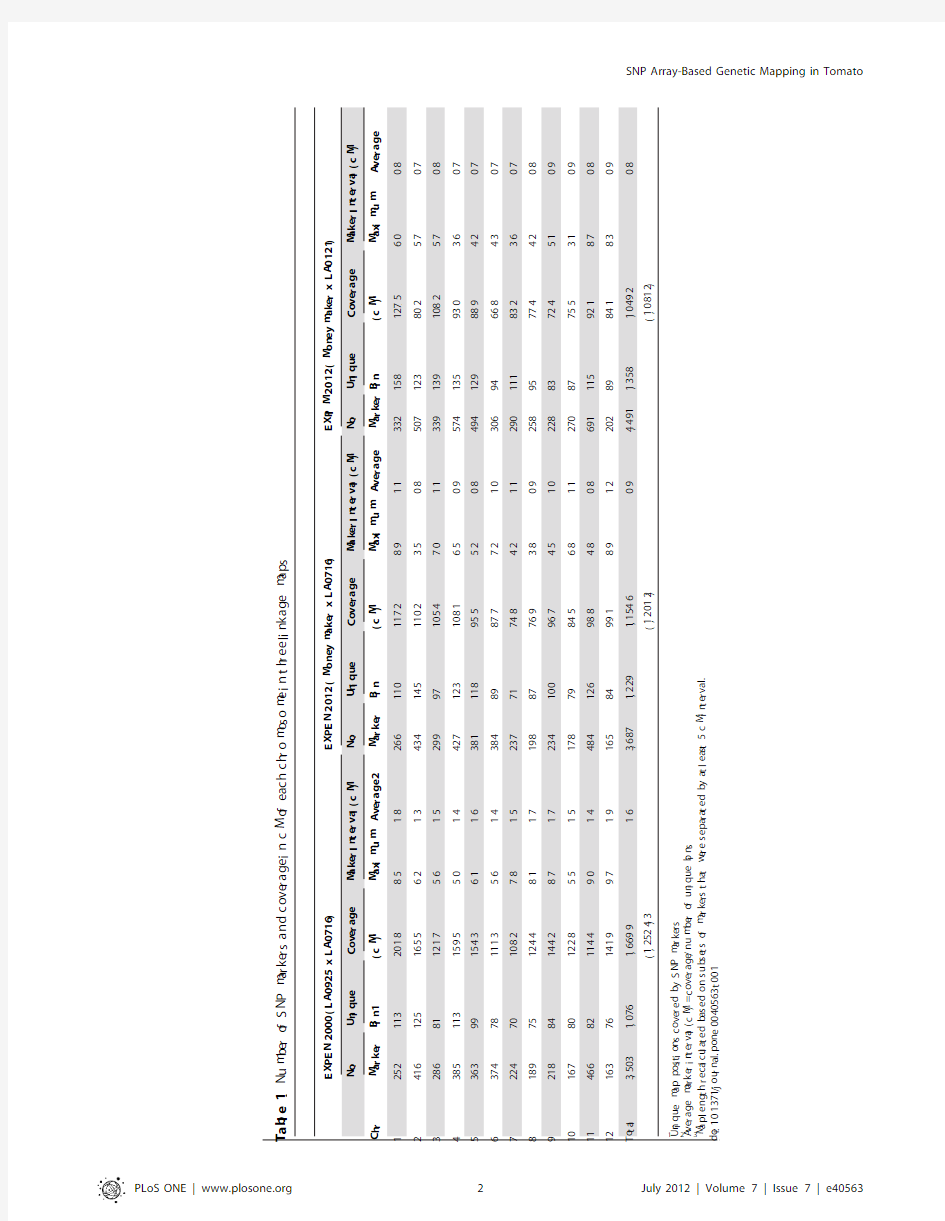
T a b l e 1.N u m b e r o f S N P m a r k e r s a n d c o v e r a g e i n c M o f e a c h c h r o m o s o m e i n t h r e e l i n k a g e m a p s .
E X P E N 2000(L A 0925x L A 0716)
E X P E N 2012(M o n e y m a k e r x L A 0716)
E X P I M 2012(M o n e y m a k e r x L A 0121)
N o .U n i q u e C o v e r a g e
M a k e r I n t e r v a l (c M )
N o .U n i q u e C o v e r a g e M a k e r I n t e r v a l (c M )N o .U n i q u e C o v e r a g e
M a k e r I n t e r v a l (c M )
C h r M a r k e r B i n 1
(c M )
M a x i m u m A v e r a g e 2
M a r k e r B i n (c M )M a x i m u m A v e r a g e M a r k e r B i n
(c M )
M a x i m u m
A v e r a g e
1252113
201.8
8.5
1.8266110117.28.91.1332158
127.5
6.0
0.8
2416125
165.5
6.2
1.3434145110.23.50.8507
123
80.2
5.7
0.7
328681
121.7
5.6
1.529997105.47.01.1339
139
108.2
5.7
0.8
4385113
159.5
5.0
1.4427123108.16.50.9574
135
93.0
3.6
0.7
536399
154.3
6.1
1.638111895.55.20.8
494
129
88.9
4.2
0.7
637478
111.3
5.6
1.43848987.77.21.0
306
94
66.8
4.3
0.7
722470
108.2
7.8
1.52377174.84.21.1
290
111
83.2
3.6
0.7
818975
124.4
8.1
1.71988776.93.8
0.9
258
95
77.4
4.2
0.8
921884
144.2
8.7
1.723410096.74.5
1.0
228
83
72.4
5.1
0.9
1016780
122.8
5.5
1.51787984.56.8
1.1
270
87
75.5
3.1
0.9
1146682
114.4
9.0
1.448412698.84.8
0.8
691
115
92.1
8.7
0.8
1216376
141.9
9.7
1.91658499.1
8.9
1.2
202
89
84.1
8.3
0.9
T o t a l 3,5031,076
1,669.9
1.63,6871,2291,154.6
0.9
4,491
1,358
1,049.2
0.8
(1,252.4)3
(1,201.2)
(1,081.2)
1
U n i q u e m a p p o s i t i o n s c o v e r e d b y S N P m a r k e r s .2
A v e r a g e m a r k e r i n t e r v a l (c M )=c o v e r a g e /n u m b e r o f u n i q u e b i n s .3M a p l e n g t h r e c a l c u l a t e d b a s e d o n s u b s e t s o f m a r k e r s t h a t w e r e s e p a r a t e d b y a t l e a s t 5c M i n t e r v a l.d o i :10.1371/j o u r n a l.p o n e .0040563.t 001
SNP Array-Based Genetic Mapping in Tomato
[14,15],maize[16],durum wheat[17],sugarcane[18],soybean [19,20],and potato[21].In tomato,NGS of the transcriptome produced17Gb of sequence for six accessions and led to the identification of62,576non-redundant SNPs[22].
High-throughput SNP discovery has been paralleled by the development of genotyping platforms that permit cost-effective scoring of many thousands of SNPs in a highly parallel fashion [23,24]facilitating high-density genetic map construction.For maize,an array consisting of49,585SNPs was used to develop two linkage maps with20,912and14,524markers,respectively[25]. In the age of incomplete genome sequences and partial physical maps,high resolution genetic maps remain an essential resource. Such maps help to improve genome assemblies,provide estimates of recombination relative to physical distance,and remain an essential feature for the dissection of complex traits.The information provides an essential guide to genomic assisted crop improvement,where recombination remains a constraint.
In order to facilitate genetic analysis and breeding,we developed the first large scale SNP genotyping array for tomato using8,784SNPs mainly discovered based on NGS-derived transcriptome sequences for six accessions[22].Three high-resolution linkage maps were constructed using interspecific F2 populations to provide details of genetic order,recombination,and their position relative to the draft assembly of the tomato reference genome sequence.The SNP array and high-density linkage maps will be useful for population level analysis,trait discovery,and selection for cultivar improvement in tomato.
Results
SNP Array
We developed a genotyping array on the Illumina Infinium platform(Illumina Inc.,San Diego,CA,USA)based on8,784 SNPs.These SNPs represented a highly filtered and selected set, optimized for polymorphism detection among cultivated germ-plasm and spread throughout the genome.Of these,7,720SNPs (88%)passed manufacturing quality control(Table S1).A failure rate of12%was considered normal and acceptable(less than15% is expected according to the manufacturer).The scorable SNPs included501from candidate genes and1,307that were cross-validated with community data sets from TraitGenetics(Gate-rsleben,Germany),the French National Institute for Agricultural Research(Institut National de la Recherche Agronomique, INRA),and previously published SNPs[22,26,27](Table S1). Genetic Map Construction
The widely used tomato reference population EXPEN2000was used to develop a SNP map(EXPEN2000-SNP)based on79F2 individuals from a cross between LA0925(S.lycopersicum)and LA0716(S.pennellii).Among7,720scorable SNPs on the array, 3,640were polymorphic between the parental lines and were analyzed in the mapping population.3,503SNP markers could be placed as codominant markers on the linkage map representing 1,076unique map positions(genetic bins)with an average marker bin interval of 1.6cM and the largest gap of9.7cM on chromosome12(Table1and Table S2).Each chromosome was covered by70–125genetic bins.We observed an uneven distribution of the markers on the array across all12chromosomes that was not in agreement with the reported chromosomal size [28].For example,252SNPs covered201.8cM(113genetic bins) on chromosome1,while466SNPs covered114.4cM(82genetic bins)on the cytologically smaller chromosome11.For a confirmation of the chromosomal marker assignment,the SNP markers that were polymorphic between M82and S.pennellii LA0716were also localized on the reference introgression lines (ILs)[29]that were available for most of the tomato genome (except parts of chromosomes4,5,8and9).The linkage mapping and the IL assignment were consistent with very few mismatches (Table S2).
Since the EXPEN2000-SNP map was based on relatively few (n=79)individuals and the introgression lines did not cover all chromosomal regions,another linkage map(EXPEN2012)was generated based on160F2individuals derived from a cross between Moneymaker(S.lycopersicum)and LA0716.Of3,770 polymorphic SNPs between the parental lines,3,687markers (1,229genetic bins)were mapped with an average marker bin interval of0.9cM(Table1and Table S3).The two largest gaps of 8.9cM each were on chromosomes1and12.As in the EXPEN 2000-SNP map,the number of polymorphic markers for each chromosome did not correlate fully with the chromosomal size with the discrepancy being most pronounced for chromosome1 and11(Table1).Otherwise,the marker distribution between the two EXPEN maps was comparable.
In addition to the two EXPEN maps which were based on crosses between red-fruited species S.lycopersicum and the green-fruited S.pennellii,the EXPIM2012map was analyzed with183F2 individuals derived from a more narrow cross between Money-maker(S.lycopersicum)and the red fruited LA0121(S.pimpinellifo-lium).Among4,792polymorphic SNPs between the parental lines, 4,491markers were mapped as codominant loci representing 1,358genetic bins with an average marker bin interval of0.8cM and the largest gap of8.7cM on chromosome11(Table1and Table S4).The distribution of the SNP markers across all chromosomes was again similar to the other linkage maps (Table1).The map of chromosome1consisted of332SNP markers covering127.5cM and158unique bins while the map of chromosome11consisted of691SNP markers covering92.1cM and115unique bins.
Genetic Map Length
The total genetic distance of the EXPEN2000-SNP map was estimated as1,669.9cM,or approximately45%larger than the EXPEN2012map(1,154.6cM)and59%larger than the EXPIM 2012map(1,049.2cM)(Table1).Although our estimate of genetic length for the EXPEN2000-SNP map was marginally larger than expected based on previous estimates of genetic map length for this population(1,503cM)[9],we were concerned about discrepancies in size between the three populations.One possible explanation for the observed increase in the amount of recombination in the EXPEN2000-SNP map could be selection at gametophytic and post-zygotic stages,leading to distorted segregation and inflated estimates of recombination in that specific population.To address this possibility,we investigated whether there was an excess of chromosomes with distorted makers. Chromosomes1,10and11contained a high proportion of distorted markers.A test for correlations between map expansion and distorted segregation did not support a positive relationship (m=20.7;R2=0.19;P=0.146)suggesting that distorted segre-gation was not responsible for the expanded map.
An alternative explanation for the map expansion observed for the EXPEN2000-SNP map compared to the EXPEN2012map relates to the large number of makers scored and the small population size.The accuracy of the calculations for genetic distance is influenced by population size since a falsely scored or incorrectly ordered marker has a larger effect in a smaller population.The EXPEN2000-SNP map length may be overestimated as a result of population size which limits accurate estimation of marker order and genetic distances.To address this
hypothesis,we repeated the EXPEN2000-SNP map construction by selecting307–325markers that were separated by at least5cM interval and recalculated the genetic map.This resampling analysis led to estimates of map length that were reduced by an average of25%(range22–27%)relative to the EXPEN2000-SNP map length based on all markers(Table1).This reduction was not observed when the same approach was used in the EXPEN2012 and EXPIM2012populations(Table1).These results suggest that the small population size of the EXPEN2000-SNP reference map limited the ability to accurately determine marker distance based on recombination when marker density was high.
The approach of creating a series of resampled maps allowed us to compare map length between the EXPEN2012and EXPIM 2012populations.The10%difference between the two maps was significant based on over100iterations.The EXPEN2012map was significantly(P,0.001)longer for chromosomes2,4,5,6,9, 10,11and12.The EXPIM2012map was significantly(P,0.001) longer for chromosome1and7.No differences were detected for average distances on chromosome3and8,though there may be differences in recombination length between the two maps for the arms of chromosome8.
Chromosome Assignment and Colinearity between Genetic Maps
The genetic positions of5,621SNP markers across12 chromosomes could be determined with3,149markers in common between the EXPEN2000-SNP and EXPEN2012 maps;2,509markers in common between EXPEN2000-SNP and EXPIM2012maps;and2,841markers in common between EXPEN2012and EXPIM2012maps(Table2and Tables S5, S6,S7).All of the shared markers showed highly conserved chromosome assignments.As with the individual maps,the number of markers in common for each chromosome varied and ranged from106on chromosome12to413on chromosome 11(Table2).In order to assess levels of colinearity between the linkage maps,the common markers were ranked based on their chromosome positions and their rank orders were used for regression analysis.High levels of colinearity(0.96–1.00regression coefficients)were observed across12chromosomes between both EXPEN maps(Table2).The EXPIM2012map showed coefficients of colinearity ranging between0.85–0.99for the EXPEN2000-SNP comparison and0.98–1.00for the EXPEN 2012comparison again indicating that the larger EXPEN2012 map is most likely more accurate.Due to map quality,further comparative analysis was conducted only between the EXPEN 2012and EXPIM2012maps which were of comparable population size(160vs.183individuals).Plotting the common markers based on rank order revealed several regions with inverse marker orders,characterized by a strong linear correlation with a negative slope over short distances,between these linkage maps. Specifically,patterns on chromosome1(coordinates20,20), chromosome3(coordinates40,40),chromosome6(coordinates 20,20),chromosome7(coordinates5,5and140,140),and chromosome9(coordinates20,20)are consistent with inversions between the S.pimpinellifolium LA0121and S.pennellii LA0716 parents(Figure1).Regions on chromosome1(coordinates100, 100)and chromosome2(coordinates60,60)highlight where marker order diverges,but evidence for a simple inversion based on a strong negative correlation is less robust(Figure1). Comparison between Genetic and Physical Positions
In addition to the genetic map position,the physical positions of 7,666SNPs were determined relative to the tomato reference genome sequence[30](Table S1)and available through the Solanaceae Genome Network(SGN;https://www.doczj.com/doc/5f10271742.html,).A total of758Mbp of the tomato genome was covered by the SNP markers on the array with an average distance between markers of 0.12Mbp(Table3).Chromosome1showed the largest physical gap with no markers(7.36Mbp)followed by a region on chromosome12(4.73Mbp).The most markers(1,059SNPs) were mapped on chromosome11,which is cytologically one of the smallest tomato chromosomes[28].
Among the7,666SNPs with physical positions,5,296SNP markers were mapped on one or both of the EXPEN2012and EXPIM2012genetic linkage maps(Table S8).These markers were used for comparative analysis of genetic and physical positions.We found that the vast majority(99.7%)of the SNPs in the linkage maps showed conserved chromosome assignments with the corresponding physical positions.Sixteen non-syntenic markers were not genetically mapped to the assigned physical chromosomes(Table S8).Among the16non-syntenic markers, there were eight markers mapped on both linkage maps with consistent chromosome assignments.For example,two markers were mapped genetically on chromosome2,while they were physically placed on chromosomes1and3.Further comparative analysis was conducted to determine colinearity within chromo-somes.The two linkage maps revealed conserved marker order with the physical map for most regions of the genome,with chromosomes4,5,8,and11having a very high level of colinearity (Figure2and Figure3).A number of markers assigned to chromosomes3,10and12in both linkage maps were not colinear with the physical map.
The meiotic recombination rate within each chromosome was estimated based on the5,280SNP markers with conserved chromosome assignments between genetic and physical maps. High recombination was found on the distal regions across all12 chromosomes in both linkage maps,while recombination was suppressed in large regions that are most likely pericentromeric (Figure3).The linkage maps also revealed similar patterns of variation in recombination rate between chromosomes.However, recombination rates appeared to be higher in the EXPEN2012 map relative to the EXPIM2012map on chromosomes2,4,5,6, 9,10,and12,while the EXPIM2012population showed higher levels of recombination on chromosomes1and7(Figure3).On chromosome8,the overall rate of recombination appears similar, though the rate within each arm appears to differ between the two populations.These results are consistent with the results of the iterative mapping,described above.In addition,there was suppression of recombination specific to the EXPEN2012map on chromosome1(70–75Mbp),chromosome6(36–38Mbp), chromosome7(0–2Mbp and58–60Mbp),and chromosome8 (0–2Mbp)(Figure3).A recombination suppression specific to the EXPIM2012map was found on the region spanning0–4Mbp on chromosome9.
Discussion
The array with7,720scorable SNPs provides a valuable tool for high-throughput and cost-effective genotyping and mapping in tomato.The SNPs used for the array were derived from a computational pipeline based on cDNA sequences from six accessions including four representatives of large-fruited cultivated tomato,a cherry tomato and a closely related wild relative[22]. The array was optimized based on polymorphic SNP markers within cultivated lineages,allele frequency and genome coverage. In addition,501functional SNPs on the array were derived from candidate genes for traits such as disease resistance and carotenoid biosynthesis.
Given the physical length of chromosome1(largest chromo-some),the number of markers is lower than expected while the number of markers on chromosome11is higher than expected. This distribution is not due to a lack of or excess of genes on these chromosomes but is likely due to the process of SNP marker selection.Alternatively,the distribution may reflect the introgres-sion of highly polymorphic regions(e.g.containing disease resistance loci such as the I2Fusarium resistance gene or the Rx-4and Xv3bacterial spot resistance genes on chromosome11)that have created an ascertainment bias.
Despite the SNP selection for cultivated populations and the observed over-and under-representation,the SNP array provides a powerful resource for genetic map construction in interspecific populations.The EXPEN2000population has been used in the last ten years as a reference mapping population in tomato and 2,506markers have been previously mapped(http://solgenomics. net)[31,32].With the SNP array,we mapped3,503SNP markers to this population.We also generated the EXPEN2012map for the S.lycopersicum Moneymaker x S.pennellii LA0716population with3,687markers and the EXPIM2012map for the S. lycopersicum Moneymaker x S.pimpinellifolium LA0121population with4,491markers.In total,we genetically positioned5,621SNP markers including common sets of2,509–3,149markers between the linkage maps.
The length of the genetic maps derived from the two EXPEN (S.lycopersicum x S.pennellii)populations differed from each other with the EXPEN2000-SNP map length estimated to be1,670cM and the EXPEN2012map length as1,155cM.We investigated whether a possible reason for the differences in map length could be differential distortion due to gametic phase selection.If such distortion occurred in favor of LA0716alleles on one portion of the chromosome and in favor of cultivated alleles on another, recombination would be overestimated in the progeny.Although the EXPEN2000-SNP map showed a number of distorted markers on several chromosomes including chromosome1where genes affecting self and unilateral incompatibility are located[33], there was no correlation between segregation distortion and map expansion.Through the iterative analysis of marker subsets,we showed that the difference in genetic length between the two EXPEN maps was most likely due to the effect of scoring or ordering mistakes being amplified due to the small size the EXPEN2000population.Nevertheless both EXPEN maps are larger in terms of cM than the map from the EXPIM (S.lycopersicum x S.pimpinellifolium)population,and these differences were significant based on iterative estimates of map length.We expected that a genetic map generated from two more closely related parents would display a generally higher level of recombination.Our observation of greater map distance in the EXPEN populations is even more surprising given the likely existence of several small inversions between S.lycopersicum and S. pennellii which suppress recombination in these https://www.doczj.com/doc/5f10271742.html,par-ing the EXPEN2012and EXPIM2012maps suggests that there could be regions on chromosomes1,3,6,7,and9where small inversions differentiate LA0716and LA0121.A paracentric inversion on the distal end of chromosome7was previously reported in S.pennellii LA0716relative to S.pimpinellifolium LA1589 [34].Further,cytogenetic analysis revealed that interspecific crosses between S.lycopersicum and S.pennellii can lead to changes in chromosome structure presumably due to inversions and translocations[35].
High-resolution genetic mapping with a large number of markers has helped to improve genome sequence assemblies in plants[25].Comparison of genetic positions with physical positions provides an independent validation of reference genome sequence assembly.Most regions of the EXPEN2012and EXPIM 2012linkage maps were fully colinear with the current assembly of the tomato reference sequence,suggesting a very good quality of the assembly.Sixteen markers with inconsistent chromosome assignment between genetic and physical maps were observed. Among them,eight markers had consistent chromosome assign-ments between the EXPEN2012and EXPIM2012maps, suggesting that the physical position may be incorrect or that the sequences are duplicated in the genome.Thus,the high-density genetic maps provide a guide to improve the assembly of genome
Table2.Colinearity between common markers for the three linkage maps.
EXPEN2000vs.EXPEN2012EXPEN2000vs.EXPIM2012EXPEN2012vs.EXPIM2012
Chr https://www.doczj.com/doc/5f10271742.html,mon
Marker
Coefficient of
Colinearity1
https://www.doczj.com/doc/5f10271742.html,mon
Marker
Coefficient of
Colinearity
https://www.doczj.com/doc/5f10271742.html,mon
Marker
Coefficient of
Colinearity
1216 1.001840.992260.99
2377 1.003080.993280.99
32800.962130.852270.99
4341 1.003060.99361 1.00
5349 1.002870.99313 1.00
6340 1.001960.982220.99
72030.981680.951940.99
8163 1.001350.991650.99
91840.971200.911380.98
101530.991250.98147 1.00
114130.973610.92387 1.00
121300.991060.971330.99
Total3,1490.992,5090.962,841 1.00
1Colinearity within each chromosome was assessed using common markers.The markers were ranked based on their map positions and the rank order was used for regression analysis,and expressed as R2.
doi:10.1371/journal.pone.0040563.t002
sequence data.The genetic mapping of markers that are not present in the reference genome sequences can also improve the current genome assembly.
The comparisons between genetic and physical distances with several thousand markers reveal that there are similar patterns of variation in recombination rates along the tomato chromosomes. Strong recombination suppression occurs in the large pericen-tromeric regions within each chromosome.These regions repre-sent repeat-rich and gene-poor heterochromatin encompassing 77%of the tomato genome[28,36].Such recombination suppression has been noted before for tomato and is also found in many other plant species[25,37,38]albeit often not as pronounced as in tomato.
With the availability of complete genome sequences,there is a tendency for genetic mapping to be relegated to a position of secondary importance.However,trait discovery,functional characterization,and crop improvement are largely dependent on recombination.Therefore,the construction of genetic maps which maximize the amount of recombination remains an essential tool in plant biology and plant breeding for precise and cost-efficient localization of traits and the generation of specific recombination events adjacent to interesting genes.Our data suggest that different crosses could reveal different general and location-specific levels of recombination,and that these differences are not necessarily related to the genetic distance between parents. The SNP array and high-density genetic maps developed in this study will be useful in population level analysis of germplasm collections representing different market classes of cultivated tomato,regionally adapted populations and wild relatives.Other applications of the resource include genome-wide association mapping with high resolution and marker-assisted selection(MAS) for tomato breeding.For association mapping,accounting for population structure and/or familial relatedness is often necessary to avoid spurious marker-trait associations[39].Large sets of genome-wide SNP markers will help to precisely estimate the relatedness and capture effects of quantitative trait loci(QTL). Association mapping has the potential to increase the efficiency of MAS by identifying markers tightly linked to traits of interest in germplasm panels that are directly relevant to plant breeders.In addition,the SNP array may facilitate genomic selection(GS)for plant breeding.As first suggested in animal improvement,GS seeks to predict the breeding value of individuals using markers distributed across the genome[40].With the advent of high-throughput and cost-effective genotyping methods,GS is showing promise for improving complex traits in plant populations[41–43].In summary,the SNP array provides a survey tool for the tomato research community and creates new opportunities for innovative strategies in both basic research and applied breeding. Materials and Methods
Plant Material
For genetic mapping,we used79F2progeny from the EXPEN 2000population S.lycopersicum(LA0925)x S.pennellii(LA0716) which was previously published[31,32].To distinguish the new SNP map from the EXPEN2000reference map,we referred to the map described here as EXPEN2000-SNP.The two other mapping populations were generated by TraitGenetics with the EXPEN2012consisting of160F2progeny from a S.lycopersicum Moneymaker x S.pennellii(LA0716)cross and the EXPIM2012 population of183F2progeny derived from Moneymaker x S. pimpinellifolium(LA0121)[44].The available S.pennellii introgres-sion lines in the M82background[29]were also used to compare marker assignment with the EXPEN SNP maps.
SNP Array Development
SNPs for the array were selected based on a multi-tier strategy that was optimized for polymorphisms within and among cultivated types.Briefly,SNP discovery was based on the Genome Analyzer II-derived transcriptome sequences of four cultivated tomato accessions(NC84173,Fla.7600,OH08-6405,and OH9242),an S.lycopersicum var.cerasiforme accession(PI114490), and an S.pimpinellifolium accession(PI128216)[22].SNPs were filtered such that any SNP within50bp of an intron/exon junction was removed and SNPs within50bp of a second polymorphism were excluded.The frequency of SNP occurrence among the six sequenced accessions was then assessed,with SNPs preferentially chosen based on their occurrence in multiple accessions.Genome coverage was assessed,and additional SNPs were selected to improve spacing across the genome.The research community provided a set of candidate genes of interest and567 SNPs in the high confidence SNP set were located in these genes. Finally,SNPs were cross-validated with data sets from TraitGe-netics,INRA,and previously published SNPs[26,27].We included1,470validated SNPs from these data sets on the array.
A total of8,784SNPs detected with10,000probes were used to design the array(Table S1).
Genotyping
Genomic DNA was isolated from fresh,young leaf tissue using a modified CTAB method[45].Original DNA for the75F2 individuals of the EXPEN2000population was provided by
Figure1.Regression of marker order between the EXPEN2012and EXPIM2012linkage maps.The2,841SNP markers common to both maps were ranked based on their map positions within chromosomes for each map and the rank orders were used for regression analysis.
doi:10.1371/journal.pone.0040563.g001
Table3.Physical coverage of7,666SNP markers.
Marker Interval(Mbp)
Chr No.Marker Coverage(Mbp)Maximum Average
155490.137.360.17
287149.48 3.830.06
367964.70 4.380.10
486164.01 2.030.08
578364.91 2.700.09
674845.88 2.660.06
744364.98 3.930.15
839662.97 2.950.16
947367.60 4.520.15
1040564.74 3.170.16
111,05953.28 2.370.05
1239465.32 4.730.17
Total7,666758.000.12
Flanking sequences of SNPs were used for the automatic batch BLAST against
the Tomato WGS chromosome database(v SL2.40;https://www.doczj.com/doc/5f10271742.html,/
organism/Solanum_lycopersicum/genome).The actual SNP positions relative to
the Tomato genome sequence were identified using a custom Python script.
doi:10.1371/journal.pone.0040563.t003
Steven Tanksley (Cornell University,Ithaca,New York,USA)We also obtained DNA from the S.pennellii introgression lines in the M82background from Dani Zamir (Hebrew University,Rehovot,Israel).Genotyping with the array was performed according to the manufacturer’s instructions for Illumina Infinium assay.The resulting intensity data was processed using the genotyping module v1.7.4of the GenomeStudio software (Illumina Inc.,San Diego,CA,USA)for SNP calling.In order to determine SNP genotype,a cluster file developed by TraitGenetics based on 92hybrids facilitated allele calling in the Genome Studio software.
Genetic and Physical Mapping
Three different software packages were used for mapping of the markers:JoinMap 4.0[46],Map Manager QTXb20[47],and MapChart 2.2[48].First,the genotyping data were transformed into the respective mapping data format (‘‘ABH’’,A =genotype parent 1,B =genotype parent 2,H =heterozy-gous).Subsequently,the JoinMap 4.0program was used for verification of the segregation patterns,the formation of linkage groups and the preliminary positioning of the markers on
chromosomes using the default grouping settings and the maximum likelihood mapping algorithm.
The final map position of the markers and the genetic distances between the markers were further optimized manually with respect to the number of crossovers (as low as possible)and the length of the linkage group (as short as possible)using the ABH mapping data file in Excel and MapManager QTX (settings:linkage evaluation F 2intercross,search linkage criterion P =0.05,map function Kosambi,cross type line cross).The final map was drawn using MapChart 2.2.
In order to compare maps,an iterative approach was used in which at least 60independent maps were created for each of the three populations.For each iteration,217–325markers were chosen based on a filter for 5cM separation (determined by initial mapping).Map construction followed the steps described above,and comparisons between total map length and individual chromosome lengths were based on Analysis of Variance.
We determined the physical map position of the SNPs based on the flanking sequences used to develop the high-density Infinium array.These sequences were oriented relative to the genome sequence using the automated batch BLAST feature to search
the
Figure https://www.doczj.com/doc/5f10271742.html,parative analysis of the EXPEN 2012and EXPIM 2012genetic maps relative to the draft assembly (v SL2.40;https://www.doczj.com/doc/5f10271742.html,/organism/Solanum_lycopersicum/genome )of the tomato reference genome sequence.doi:10.1371/journal.pone.0040563.g002
Tomato WGS chromosome(v SL2.40;https://www.doczj.com/doc/5f10271742.html,/ organism/Solanum_lycopersicum/genome)[30].For a SNP with multiple BLAST hits,the best match was used to infer a map position.A custom Python script was then used to identify the actual SNP positions relative to the SL2.40genome sequence.We first calculated the59flanking sequence length for each SNP.The script determined sequence orientation based on start and end positional information,and the SNP position was determined by adding or subtracting,depending on sequence orientation,the length of the flanking sequence to the corresponding subject start position.The accuracy of SNP positions was manually verified using a subset of data.
Supporting Information
Table S18,784SNPs used for array development in this study.
(XLSX)
Table S23,503SNP markers in the EXPEN2000 (LA0925x LA0716)linkage map and their assignment on the introgression line population of S.pennellii(IL). (XLSX)
Table S33,687SNP markers in the EXPEN2012 (Moneymaker x LA0716)linkage map.
(XLSX)
Table S44,491SNP markers in the EXPIM2012 (Moneymaker x LA0121)linkage map.
(XLSX)Table S53,149SNP markers mapped on both the EXPEN2000and EXPEN2012linkage maps. (XLSX)
Table S62,509SNP markers mapped on both the EXPEN2000and EXPIM2012linkage maps. (XLSX)
Table S72,841SNP markers mapped on both the EXPEN2012and EXPIM2012linkage maps. (XLSX)
Table S85,295SNP markers with both genetic and physical positions.
(XLSX)
Acknowledgments
We would like to thank Cindy Lawley of Illumina Inc.for her coordination of the Tomato SNP array Consortium.We also thank internal reviewers at The Ohio State University,OARDC for comments and helpful suggestions on the manuscript.TraitGenetics acknowledges the excellent technical assistance of Sandra Reis and Steffie Wehle.For the INRA SNPs,Gautier Sarah and Jean Paul Bouchet are acknowledged for bioinformatic analyses and Ste′phane Munos,Nicolas Ranc,Sylvain Santoni and Laure Sene′for production of sequences.
Author Contributions
Conceived and designed the experiments:SCS MWG AVD CRB DMF. Performed the experiments:SCS GD JP RW JPH.Analyzed the data:SCS GD JP RW JPH DMF.Contributed reagents/materials/analysis tools:MC SW.Wrote the paper:SCS MWG DMF.
References
1.Martin GB,Brommonschenkel SH,Chunwongse J,Frary A,Ganal MW,et al.
(1993)Map-based cloning of a protein kinase gene conferring disease resistance in tomato.Science262:1432–1436.
2.Jones DA,Thomas CM,Hammondkosack KE,Balintkurti PJ,Jones JDG(1994)
Isolation of the tomato Cf-9gene for resistance to Cladosporium fulvum by transposon tagging.Science266:789–793.
3.Kawchuk LM,Hachey J,Lynch DR,Kulcsar F,van Rooijen G,et al.(2001)
Tomato Ve disease resistance genes encode cell surface-like receptors.Proc Natl Acad Sci U S A98:6511–6515.
https://www.doczj.com/doc/5f10271742.html,ligan SB,Bodeau J,Yaghoobi J,Kaloshian I,Zabel P,et al.(1998)The root
knot nematode resistance gene Mi from tomato is a member of the leucine zipper,nucleotide binding,leucine-rich repeat family of plant genes.Plant Cell 10:1307–1319.
5.Pnueli L,CarmelGoren L,Hareven D,Gutfinger T,Alvarez J,et al.(1998)The
SELF-PRUNING gene of tomato regulates vegetative to reproductive switching of sympodial meristems and is the ortholog of CEN and TFL1.Development125: 1979–1989.
6.Xiao H,Jiang N,Schaffner E,Stockinger EJ,van der Knaap E(2008)A
retrotransposon-mediated gene duplication underlies morphological variation of tomato fruit.Science319:1527–1530.
7.Ronen G,Carmel-Goren L,Zamir D,Hirschberg J(2000)An alternative
pathway to beta-carotene formation in plant chromoplasts discovered by map-based cloning of Beta and old-gold color mutations in tomato.Proc Natl Acad Sci U S A97:11102–11107.
8.Tanksley SD,Ganal MW,Prince JP,Devicente MC,Bonierbale MW,et al.
(1992)High-density molecular linkage maps of the tomato and potato genomes.
Genetics132:1141–1160.
9.Shirasawa K,Isobe S,Hirakawa H,Asamizu E,Fukuoka H,et al.(2010)SNP
Discovery and Linkage Map Construction in Cultivated Tomato.DNA Research17:381–391.
10.Robbins MD,Sim S,Yang W,Van Deynze A,van der Knaap E,et al.(2011)
Mapping and linkage disequilibrium analysis with a genome-wide collection of SNPs that detect polymorphism in cultivated tomato.Journal of experimental botany62:1831–1845.
11.Shendure J,Ji H(2008)Next-generation DNA sequencing.Nat Biotechnol26:
1135–1145.12.Deschamps S,Campbell MA(2010)Utilization of next-generation sequencing
platforms in plant genomics and genetic variant discovery.Mol Breed25:553–570.
13.Davey JW,Hohenlohe PA,Etter PD,Boone JQ,Catchen JM,et al.(2011)
Genome-wide genetic marker discovery and genotyping using next-generation sequencing.Nature Reviews Genetics12:499–510.
14.McNally KL,Childs KL,Bohnert R,Davidson RM,Zhao K,et al.(2009)
Genomewide SNP variation reveals relationships among landraces and modern varieties of rice.Proc Natl Acad Sci U S A106:12273–12278.
15.Yamamoto T,Nagasaki H,Yonemaru J,Ebana K,Nakajima M,et al.(2010)
Fine definition of the pedigree haplotypes of closely related rice cultivars by means of genome-wide discovery of single-nucleotide polymorphisms.BMC Genomics11:267.
16.Barbazuk WB,Emrich SJ,Chen HD,Li L,Schnable PS(2007)SNP discovery
via454transcriptome sequencing.Plant J51:910–918.
17.Trebbi D,Maccaferri M,de Heer P,Sorensen A,Giuliani S,et al.(2011)High-
throughput SNP discovery and genotyping in durum wheat(Triticum durum Desf.).Theor Appl Genet123:555–569.
18.Bundock PC,Eliott FG,Ablett G,Benson AD,Casu RE,et al.(2009)Targeted
single nucleotide polymorphism(SNP)discovery in a highly polyploid plant species using454sequencing.Plant Biotechnol J7:347–354.
19.Hyten DL,Cannon SB,Song QJ,Weeks N,Fickus EW,et al.(2010)High-
throughput SNP discovery through deep resequencing of a reduced represen-tation library to anchor and orient scaffolds in the soybean whole genome sequence.BMC Genomics11:38.
20.Kim MY,Lee S,Van K,Kim TH,Jeong SC,et al.(2010)Whole-genome
sequencing and intensive analysis of the undomesticated soybean(Glycine soja Sieb.and Zucc.)genome.Proc Natl Acad Sci U S A107:22032–22037. 21.Hamilton JP,Hansey CN,Whitty BR,Stoffel K,Massa AN,et al.(2011)Single
nucleotide polymorphism discovery in elite north american potato germplasm.
BMC Genomics12:12.
22.Hamilton JP,Sim S,Stoffel K,Van Deynze A,Buell CR,et al.(2012)Single
nucleotide polymorphism discovery in cultivated tomato via sequencing by synthesis.The Plant Genome5:17–29.
23.Steemers FJ,Chang WH,Lee G,Barker DL,Shen R,et al.(2006)Whole-
genome genotyping with the single-base extension assay.Nat Methods3:31–33.
Figure3.Relationship between genetic and physical positions within each chromosome.The genetic positions of SNP markers are indicated by red circles for the EXPEN2012population and blue triangles for the EXPIM2012population.
doi:10.1371/journal.pone.0040563.g003
24.Gupta PK,Rustgi S,Mir RR(2008)Array-based high-throughput DNA
markers for crop improvement.Heredity101:5–18.
25.Ganal MW,Durstewitz G,Polley A,Berard A,Buckler ES,et al.(2011)A large
maize(Zea mays L.)SNP genotyping array:development and germplasm genotyping,and genetic mapping to compare with the B73reference genome.
PLoS ONE6:e28334.
26.Van Deynze A,Stoffel K,Buell CR,Kozik A,Liu J,et al.(2007)Diversity in
conserved genes in tomato.BMC Genomics8:465.
27.Sim SC,Robbins MD,Chilcott C,Zhu T,Francis DM(2009)Oligonucleotide
array discovery of polymorphisms in cultivated tomato(Solanum lycopersicum L.) reveals patterns of SNP variation associated with breeding.BMC Genomics10:
10.
28.Sherman JD,Stack SM(1992)Two-dimensional spreads of synaptonemal
complexes from solanaceous plants.5.Tomato(Lycopersicon esculentum)karyotype and idiogram.Genome35:354–359.
29.Eshed Y,Zamir D(1995)An introgression line population of Lycopersicon pennellii
in the cultivated tomato enables the identification and fine mapping of yield-associated QTL.Genetics141:1147–1162.
30.The Tomato Genome Consortium(2012)The tomato genome sequence
provides insights into fleshy fruit evolution.Nature485:635–641.
31.Fulton TM,Van der Hoeven R,Eannetta NT,Tanksley SD(2002)
Identification,analysis,and utilization of conserved ortholog set markers for comparative genomics in higher plants.Plant Cell14:1457–1467.
32.Frary A,Xu YM,Liu JP,Mitchell S,Tedeschi E,et al.(2005)Development of a
set of PCR-based anchor markers encompassing the tomato genome and evaluation of their usefulness for genetics and breeding experiments.Theor Appl Genet111:291–312.
33.Chetelat RT,Deverna JW(1991)Expression of unilateral incompatibility in
pollen of Lycopersicon pennellii is determined by major loci on chromosomes1,6 and10.Theor Appl Genet82:704–712.
34.van der Knaap E,Sanyal A,Jackson SA,Tanksley SD(2004)High-resolution
fine mapping and fluorescence in situ hybridization analysis of sun,a locus controlling tomato fruit shape,reveals a region of the tomato genome prone to DNA rearrangements.Genetics168:2127–2140.
35.Anderson LK,Covey PA,Larsen LR,Bedinger P,Stack SM(2010)Structural
differences in chromosomes distinguish species in the tomato clade.Cytogenet Genome Res129:24–34.36.Stack SM,Royer SM,Shearer LA,Chang SB,Giovannoni JJ,et al.(2009)Role
of Fluorescence in situ Hybridization in Sequencing the Tomato Genome.
Cytogenet Genome Res124:339–350.
37.Frary A,Presting GG,Tanksley SD(1996)Molecular mapping of the
centromeres of tomato chromosomes7and9.Mol Gen Genet250:295–304.
38.Wenzl P,Li HB,Carling J,Zhou MX,Raman H,et al.(2006)A high-density
consensus map of barley linking DArT markers to SSR,RFLP and STS loci and agricultural traits.BMC Genomics7:206.
39.Yu J,Pressoir G,Briggs WH,Vroh Bi I,Yamasaki M,et al.(2006)A unified
mixed-model method for association mapping that accounts for multiple levels of relatedness.Nat Genet38:203–208.
40.Meuwissen THE,Hayes BJ,Goddard ME(2001)Prediction of total genetic
value using genome-wide dense marker maps.Genetics157:1819–1829. 41.Asoro FG,Newell MA,Beavis WD,Scott MP,Jannink JL(2011)Accuracy and
Training Population Design for Genomic Selection on Quantitative Traits in Elite North American Oats.The Plant Genome4:132–144.
42.Heffner EL,Jannink JL,Iwata H,Souza E,Sorrells ME(2011)Genomic
Selection Accuracy for Grain Quality Traits in Biparental Wheat Populations.
Crop Sci51:2597–2606.
43.Zhao Y,Gowda M,Liu W,Wu¨rschum T,Maurer HP,et al.(2012)Accuracy of
genomic selection in European maize elite breeding populations.Theor Appl Genet124:769–776.
44.Ernst K,Kumar A,Kriseleit D,Kloos DU,Phillips MS,et al.(2002)The broad-
spectrum potato cyst nematode resistance gene(Hero)from tomato is the only member of a large gene family of NBS-LRR genes with an unusual amino acid repeat in the LRR region.Plant J31:127–136.
45.Kabelka E,Franchino B,Francis DM(2002)Two loci from Lycopersicon hirsutum
LA407confer resistance to strains of Clavibacter michiganensis subsp.michiganensis.
Phytopathology92:504–510.
46.Van Ooijen JW(2006)JoinMap H4.0,Software for the calculation of genetic
linkage maps in experimental populations.Kyazma B.V.,Wageningen, Netherlands.
47.Manly KF,Cudmore RH Jr,Meer JM(2001)Map Manager QTX,cross-
platform software for genetic mapping.Mamm Genome12:930–932.
48.Voorrips RE(2002)MapChart:software for the graphical presentation of
linkage maps and QTLs.J Hered93:77–78.
液相色谱-四极杆/飞行时间质谱联用(HPLC-QTOF) 一、开机 1.打开计算机,LAN Switch电源。 2.打开液相各个模块电源,打开质谱前面的电源开关,等待大约两分钟,当听到第二声溶剂阀切换的声音(表明质谱自检完成)后,仪器可以联机。 3.在计算机桌面上双击MassHunter采集软件图标,进入MassHunter工作站。 4.如果MassHunter工作站在之前曾经打开和关闭过,请确认在再次打开工作站之前,关闭MassHunter所有的进程;双击桌面上的图标,在弹出的窗口点击Shut Down,等待所有的Status都变为Terminated后,点击Close。然后再打开MassHunter工作站。注意:在MassHunter采集软件关闭后,再次打开之前,必须执行上面的操作,否则无法进入采集软件。 5. 点击Standby按钮,检查前级真空(典型值应≤2.5Torr)和高真空,等到高真空≤2×10⁻⁶Torr后,关闭工作站。 6. 进入仪器诊断软件界面,在菜单上选择Connection > Connect,输入IP地址 192.168.254.12,点击OK。 根据不同的情况,选择不同的Condition HV的模式。0.6 Hour Cycle (Quick Vent) 适用于Q-TOF短暂关机后的Condition,比如更换泵油,短时间停电等。2 Hour Cycle (Optics Service) 适用于对Q-TOF关机,进行简单维护后的Condition,比如清洗毖绅管等。8 Hour Cycle (TOF Service) 适用于对Q-TOF关机,进行比较长时间的维修后的Condtion,比如仪器出现故障后Agilent工程师上门维修后再次开机。13 Hour Cycle (Installation) 适用于Q-TOF安装时第一次开机后的Condtion;当者是比如长假关机后再次开机。 7. 标签栏显示Instrument ON/OFF界面,点击Condition HV。 8. 当Condition HV结束后,在File菜单上选择Connection > Disconnect,关闭TOF Diagnostics软件。 9. 重新进入MassHunter工作站。 二、调谐和校正
跨国公司供应链管理管理案例分析 ——韩国现代携手Samyeong电缆 本文根据《运营管理》(第11版,理查德B蔡斯、罗伯特·雅各布斯、巴古拉·阿奎拉诺著,任建标等译,机械工业出版社,2007)修订而成。特此说明! 从某种程度上来说,可以将供应链和客户关系看作是一体化的。例如,A是B的供应商,那么B也就是A的客户。在B的供应链管理中,B所强调的就是对A的供应商管理;而在A的价值链中,A所强调的就是对B的客户关系管理。我们以下将从韩国现代汽车(B)携手Samyeong(A)电缆公司的案例中分析这种关系。 1. 现代汽车公司简介 现代汽车公司是由在韩国历史上最富传奇色彩的商业巨子郑周永先在1967年一手创办的韩国最大汽车企业。现代汽车公司年生产能力为145万辆,可以生产从轿车、客车、货车至特种车的各类型车种。其轿车产品主要有:Accent、Elantra、Sonata、 Grandeur、Dynasty等,排量从1.3升至3.5升。商用车产品主要有:H100微型客车、Chorus轻型客车、Aero大中型客车系列、各类载货汽车、牵引车、自卸车以及各种专用汽车等。 与全球其它领先的汽车公司相比,现代汽车历史虽短,却浓缩了汽车产业的发展史,它从建立工厂到能够独立自主开发车型仅用了18年(1967-1985),并且在2006年,现代汽车集团在全球汽车公司销售排名榜中已经名列第6位。韩国现代汽车的发展大致经过三个阶段: 第一阶段是1967—1970年的创业期。它和美国福特汽车公司合作,引进福特技术生产“哥蒂拉”牌小汽车,并在1970年建成年产2.6万辆生产能力的蔚山工厂。 第二阶段是1970—1975年的消化吸收期。在这期间现代公司花巨资,在公司内进行消化吸收福特技术。1974年投资1亿美元建设年产5.6万辆的新厂,1975年,该厂建成,小汽车国产化率达到100%。 第三阶段是1975年以后开始走向世界。1976年,自己设计生产的福尼牌小轿车下线,现代公司走向成熟。80年代,现代公司垄断了韩国市场,和丰田公司分手,与三菱公司结盟,生产小马牌汽车。 此外,1986年,现代公司的超小马汽车投入美国市场,当年即售出16万辆,创下汽车业销售奇迹,奠定了现代汽车公司的国际地位。现代集团计划在目前51个国家254个海外支社和30个国家111个海外当地生产销售网的基础之上,再扩充30个国家50多个海外支社或当地生产、销售网,建立世界范围的生产销售网络。
石钟山记 《水经》上说:“鄱阳湖口有座石钟山。”郦道元认为,这山下面临深潭,微风掀起波浪时,水和石互相撞击,发出的声音象大钟一样。这种说法,人们常常怀疑它。现在把钟和磬放在水里,即使大风浪也不能使它发出声音,何况石头呢。到了唐代,李渤才寻访了它的遗迹,在潭边上找到两座山石,敲着听听它的声音,南边的山石声音重浊而模糊,北边的山石声音清脆而响亮。鼓槌的敲击停止以后,声音还在传播,余音慢慢消失。他自己认为找到了石钟山命名的原因了。然而这种说法,我更加怀疑。能敲得发出铿锵作响的山石。到处都有,可是唯独这座山用钟来命名,这是为什么呢? 元丰七年农历六月丁丑那天,我从齐安乘船到临汝去,正好大儿子苏迈将要到饶州德兴县做县尉,送他到湖口,因此能够看到这座叫做“石钟”的山。庙里的和尚叫小童拿一柄斧头,在杂乱的石壁中间选择一两处敲打它,发出硿硿的响声,我仍旧笑笑,并不相信。到了晚上,月色明亮,我单独和迈儿坐小船,到绝壁下面。大石壁在旁边斜立着,高达千尺,活象凶猛的野兽、奇怪的鬼物,阴森森的想要扑过来抓人似的;山上栖息的鹘鸟,听到人声也受惊飞起,在高空中磔磔地叫着;还有象老头子在山谷中咳着笑着的声音,有的人说:“这就是鹳鹤。”我正心中惊恐想要回去。忽然,巨大的声音从水上发出,噌吰的声音象击鼓敲钟一样不停。船夫非常害怕。我仔细地观察,原来山下都是石头的洞穴和裂缝,不知它的深浅,微微的水波进入里面,冲荡撞击,便形成这种声音。船划回到两山中间,快要进入港口,有块大石头挡在水流中心,上面可以坐百来人,中间是空的,有很多窟窿,风吹浪打吞进吐出,发出窾坎镗鞳的声音,跟先前噌吰的声音互相应和,好像音乐演奏起来一样。我因而笑着对迈儿说:“你明白吗?发出噌吰响声的,那是周景王的无射钟,发出窾坎镗鞳响声的,那是魏庄子的歌钟。古人没有欺骗我们啊!” 事情没有亲眼看到、亲耳听到,却主观地推断它的有无,能行吗?郦道元见到和听到的,大概和我的见闻相同,可是说得不够详尽;一般做官读书的人又总不愿夜晚乘小船停靠在绝壁下面,所以没有谁能了解真相;而渔夫船工,虽然知道却又不能用口说出用笔写出来。这就是这座山(命名的真实原由)在世上没能流传下来的缘故啊。而浅陋的人竟用斧头敲击来寻求用钟命名的原由,还自己认为得到了它的真相。我因此把上面的情况记载下来,叹息郦道元记叙的简略,而笑李渤见识的浅陋。 【内容主旨】 本文记录了作者考察石钟山得名的原因的过程,文中的叙事,议论皆由探寻石钟山命名的来由而发,卒章显志,先得出“事不目见耳闻,而臆断其有无,可乎”的观点,再用“叹郦元之简,而笑李渤之陋”的一叹,一笑点写自己的写作意图。 全文分三个部分,第一段,对石钟山命名缘由的两种解释表示怀疑。第二段解疑,通过实地考察去探究石钟山命名的真实缘由。属记叙部分。第三段得出结论,即事情如果没有亲眼看见,亲耳听到就不能凭主观臆测去推断它的有无。属议论部分。 【写作手法】 《石钟山记》的结构不同于一般的记游性散文那样,先记游,然后议论,而是先议论,由议论带出记叙,最后又以议论作结。作者以“疑──察──结论”三个步骤展开全文。全文首尾呼应,逻辑严密,浑然一体。本文第一句就提郦道元的说法,提出别人对此说的怀疑,这种怀疑也不是没有根据,而是用钟磬作的实验为依据。这就为文章的第二段中作者所见的两处声
韩国现代集团发展史 摘要: 1. 自己专业与韩国现代企业的关系 2. 韩国现代企业简介 3. 韩国现代企业的发展历史 4. 结语关键字:韩国语现代企业发展历史经验 一.我的专业与韩国现代企业本人是吉林大学外国语学院朝鲜语系的本科生,学习标准韩国语,因为自己的专业是韩国语,所以自然要关心韩国的一切政治,经济,文化等等。为了能够更好的学习韩国语,为了很好的就业,就不得不关心韩国的企业,比如现代,三星,大宇等等。但是真正和机械工业有关系的还是现代集体,所以我选择要介绍韩国现代集团。 韩国现代集团是韩国最大的多元化综合性财团之一,创立于1967 年,创始人郑周荣先生。公司总部位于韩国汉城,在汽车、造船、数码电子、重工、机械、基建等领域都占重要地位。其下属造船业位居全球三 强,韩国现代汽车是韩国最大的汽车企业,也是世界第七大汽车生产厂 家。 韩国的企业在中国有很多,尤其是在山东,江苏,浙江沿海等地,但是在中国真正能够很有实力的就是韩国现代企业了,北京现代公 司在中国实力非常强大 为了能够就业好,所以便不得不注意韩国现代集团。
二.现代企业的简介① 韩国现代集团是韩国最大的多元化综合性财团之一,创立于1967年,创始人郑周永先生。公司总部位于韩国汉城,在汽车、造船、数码电子、重工、机械、基建等领域都占重要地位。其下属造船业位居全球三强,现代汽车公司是韩国最大的汽车企业,也是世界第七大汽车生产厂家。现代数码电子成立于八十年代初,在韩国是一家非常大且非常有影响的IT 着名企业,其产品线非常丰富,涵盖了硬件(台式机、笔记本、服务器、网络产品、数据存储、显示设备和数码娱乐产品) 、软件、在线游戏等系列产品。现代数码电子在韩国一直致力于产品的研发和OEM弋工业务,是世界众多国际品牌中高端数码产品的重要代工伙伴。现代内存目前在全球的销售量排名在世界第二。主要向全球OEM供应的厂商有IBM、HP DELL,国内主要客户是联想。其内存的生产地目前在美国和韩国本土。现弋数码电子的中国总部坐落于风景优美的上海市闵北经济技术开发区,规划用地1000余亩,是韩国现弋( Hyundai )集团在中国投资的子公司,规划投资6000万美金,用于建设现弋数码在中国的加工生产研发基地,2004年出口市场主要是日本和东南亚国家。韩国现弋品牌在中国大陆家喻户晓。2002年底对中国100个大中小城市抽样调查结果显示韩国现弋的品牌知名度高达83。7%,韩国现弋在大陆投资的产品一直保持着高科技的高端产品形象。是韩国企业 在大陆的杰出代表。现代数码电子从事计算机及其他相关产品的开发生产已有20多年的历史,是一家非常专业的硬件设备供应商。现代在全球建有5个研发基地,分别坐落于美国旧金山、日本东京、台湾新竹、韩国汉城、
《石钟山记》的原文及译文 [原文] 《水经》云:彭蠡之口有石钟山焉。郦元以为下临深潭,徽风鼓浪,水石相搏,声如洪钟。是说也,人常疑之。今以钟磬置水中,虽大风浪不能鸣也,而况石乎!至唐李渤始访其遗踪,得双石于潭上,扣而聆之,南声函胡,北音清越,桴止响腾,余韵徐歇。自以为得之矣,然是说也,余尤疑之。石之铿然有声者,所在皆是也,而此独以钟名,何哉? 元丰七年六月丁丑,余自齐安舟行适临汝,而长子迈将赴饶之德兴尉,送之至湖口,因得观所谓石钟者。寺僧使小童持斧,于乱间择其一二扣之,□□焉,余固笑而不信也。至莫夜月明,独与迈乘小舟,至绝壁下。大石侧立千尺,如猛兽奇鬼,森然欲搏人;而山上栖鹘,闻人声亦惊起,磔磔云霄间;又有若老人咳且笑于山谷中者,或曰此鹳鹤也。余方心动欲还,而大声发于水上,噌□如钟鼓不绝。舟人大恐。徐而察之,则山下皆石穴罅,不知其浅深,微波入焉,涵淡澎湃而为此也。舟回至两山间,将入港口,有大石当中流,可坐百人,空中而多窍,与风水相吞吐,有□坎镗□之声,与向之噌□者相应,如乐作焉。因笑谓迈曰:汝识之乎?噌□者,周景王之无射也,□坎镗□者,魏庄子之歌钟也。古之人不余欺也 事不目见耳闻,而臆断其有无,可乎?郦元之所见闻,殆与
余同,而言之不详;士大夫终不肯以小舟夜泊壁之下,故莫能知;而渔工水师虽知而不能言。此世所以不传也。而陋者乃以斧斤考击而求之,自以为得其实。余是以记之,盖叹郦元之简,而笑李渤之陋也。 [译文] 《水经》上说:鄱阳湖口有座石钟山。郦道元认为,这山下面临深潭,微风掀起波浪时,水和石互相撞击,发出的声音象大钟一样。这种说法,人们常常怀疑它。现在把钟和磬放在水里,即使大风浪也不能使它发出声音,何况石头呢。到了唐代,李渤才寻访了它的遗迹,在潭边上找到两座山石,敲着听听它的声音,南边的山石声音重浊而模糊,北边的山石声音清脆而响亮。鼓槌的敲击停止以后,声音还在传播,余音慢慢消失。他自己认为找到了石钟山命名的原因了。然而这种说法,我更加怀疑。能敲得发出铿锵作响的山石。到处都有,可是唯独这座山用钟来命名,这是为什么呢? 元丰七年农历六月丁丑那天,我从齐安乘船到临汝去,正好大儿子苏迈将要到饶州德兴县做县尉,送他到湖口,因此能够看到这座叫做石钟的山。庙里的和尚叫小童拿一柄斧头,在杂乱的石壁中间选择一两处敲打它,发出□□的响声,我仍旧笑笑,并不相信。到了晚上,月色明亮,我单独和迈儿坐小船,到绝壁下面。大石壁在旁边斜立着,高达千尺,活象凶猛的野兽、奇怪的鬼物,阴森森的想要扑过来抓人似的;
分子标记遗传图谱的构建 检测出的每个分子标记反映的都是相应染色体座位上的遗传多态性状态。为了有效地分析利用分子标记所提供的遗传信息,人们希望知道不同分子标记在染色体上的相对位置或排列情况,也就是要构建分子标记的遗传连锁图谱。利用DNA标记构建遗传连锁图谱在原理上与传统遗传图谱的构建是一样的。其基本步骤包括:选择适合作图的DNA标记;根据遗传材料之间的DNA多态性,选择用于建立作图群体的亲本组合;建立具有大量DNA标记处于分离状态的分离群体或衍生系;测定作图群体中不同个体或株系的标记基因型;对标记基因型数据进行连锁分析,构建标记连锁图。至今为止,已构建了许多植物的高密度分子标记连锁图。本章侧重介绍利用DNA标记构建分子遗传连锁图谱的原理与方法。 第一节作图群体的建立 要构建DNA标记连锁图谱,必须建立作图群体。建立作图群体需要考虑的重要因素包括亲本的选配、分离群体类型的选择及群体大小的确定等。 一、亲本的选配 / 亲本的选择直接影响到构建连锁图谱的难易程度及所建图谱的适用范围。一般应从四个方面对亲本进行选择,首先要考虑亲本间的DNA多态性。亲本之间的DNA多态性与其亲缘关系有着密切关系,这种亲缘关系可用地理的、形态的或同工酶多态性作为选择标准。一般而言,异交作物的多态性高,自交作物的多态性低。例如,玉米的多态性极好,一般自交系间配制的群体就可成为理想的RFLP作图群体;番茄的多态性较差,因而只能选用不同种间的后代构建作图群体;水稻的多态性居中,美国康乃尔大学实验室1988年发表的RFLP连锁图谱是以籼稻和爪哇稻之间的杂交组合为基础构建的(McCouch et al. 1988)。在作物育种实践中,育种家常将野生种的优良性状转育到栽培种中,这种亲源关系较远的杂交转育,DNA 多态性非常丰富。第二,选择亲本时应尽量选用纯度高的材料,并进一步通过自交进行纯化。第三,要考虑杂交后代的可育性。亲本间的差异过大,杂种染色体之间的配对和重组会受到抑制,导致连锁座位间的重组率偏低,并导致严重的偏分离现象,降低所建图谱的可信度和适用范围;严重的还会降低杂种后代的结实率,甚至导致不育,影响分离群体的构建。由于各种原因,仅用一对亲本的分离群体建立的遗传图谱往往不能完全满足基因组研究和各种育
石钟山记-原文-翻译
石钟山记 苏轼 《水经》云:“彭蠡之口有石钟山焉。”郦元以为下临深潭,微风鼓浪,水石相搏,声如洪钟。是说也,人常疑之。今以钟磬置水中,虽大风浪不能鸣也,而况石乎!至唐李渤始访其遗踪,得双石于潭上,扣而聆之,南声函胡,北音清越,桴止响腾,余韵徐歇。自以为得之矣。然是说也,余尤疑之。石之铿然有声者,所在皆是也,而此独以钟名,何哉? 元丰七年六月丁丑,余自齐安舟行适临汝,而长子迈将赴饶之德兴尉,送之至湖口,因得观所谓石钟者。寺僧使小童持斧,于乱石间择其一二扣之,硿硿焉。余固笑而不信也。至莫夜月明,独与迈乘小舟,至绝壁下。大石侧立千尺,如猛兽奇鬼,森然欲搏人;而山上栖鹘,闻人声亦惊起,磔磔云霄间;又有若老人咳且笑于山谷中者,或曰此鹳鹤也。余方心动欲还,而大声发于水上,噌吰如钟鼓不绝。舟人大恐。徐而察之,则山下皆石穴罅,不知其浅深,微波入焉,涵淡澎湃而为此也。舟回至两山间,将入港口,有大石当中流,可坐百人,空中而多窍,与风水相吞吐,有窾坎镗鞳之声,与向之噌吰者相应,如乐作焉。因笑谓迈曰:“汝识之乎?噌吰者,周景王之无射也;窾坎镗鞳者,魏庄子之歌钟也。古之人不余欺也!” 事不目见耳闻,而臆断其有无,可乎?郦元之所见闻,殆与余同,而言之不详;士大夫终不肯以小舟夜泊绝壁之下,故莫能知;而渔工水师虽知而不能言。此世所以不传也。而陋者乃以斧斤考击而求之,自以为得其实。余是以记之,盖叹郦元之简,而笑李渤之陋也。 注释 1、选自《苏东坡全集》。 2、彭蠡:鄱阳湖的又一名称。 3、郦元:就是郦道元,北魏人,地理学家,著《水经注》。 4、鼓:振动。 5、搏:击,拍。 6、洪钟:大钟。 7、是说:这个说法。
附件:技术参数 一、超高效液相色谱-四极杆飞行时间高分辨质谱联用仪 1.应用范围: 系统主要用于有机化合物的定性和定量分析。可分别通过多目标未知物筛查流程、完全未知物筛查流程等来开展未知物的发现和鉴定工作;还可以开展药物代谢、代谢物鉴定和代谢组学研究等。 2.工作环境条件: 2.1 电源:230Vac,?10%,50/60Hz,30A。 2.2 环境温度:15 ~ 26?C。 2.3 相对湿度:20 ~ 80%。 3.总体要求: 3.1 该系统基本组成包括超高效液相色谱部分和具有超高灵敏度、超快扫描速度的落地式高频四极杆-飞行时间串联质谱仪部分。仪器由 计算机控制、配有独立的ESI和APCI离子源。软件包括仪器调节、数据采集、数据处理、定量分析和报告。 3.2 仪器灵敏度要高,性能稳定,重复性好。 3.3 国际知名质谱公司(10年以上商品化四极杆-飞行时间质谱生 产经验)推出的主流产品,产品全部为原装进口,其性能达到或超过以下要求。 4. 质谱性能指标: 4.1 离子源:配有电喷雾离子源(ESI)、大气压化学电离源(APCI),
离子源切换方便、快速,清洗、维护方便。. 4.1.1 插拔式可互换ESI及APCI喷针,可实现ESI源及APCI源的快速更换。 4.1.2 大气压离子源采用锥孔结构,使用气帘气技术,而无毛细管(半径<1mm)设计装置,以同时保持高灵敏度和优异的抗污染能力。(要求提供接口结构图) 4.1.3 电喷雾离子源流速范围:在确保灵敏度不损失的前提下,实现高流速,无需分流,即可达到3ml/min;加快样品的分析速度同时,还可避免分流对样品造成损失。 4.1.4 大气压化学电离源流速范围:在确保灵敏度不损失的前提下,实现高流速,无需分流,即可达到3ml/min;加快样品的分析速度同时,还可避免分流对样品造成损失。 4.1.5 脱溶剂能力:离子源内采用辅助气体加热,气体最高温度可达700℃,确保最佳的离子化效率。(要求提供硬件结构图和软件界面截图作为证明文件) 4.1.6 离子源内废气排放:有主动废气排放装置,防止气体在密闭的离子源腔体中的回流,降低离子源的记忆效应和污染,降低机械泵的负荷延长机械泵泵油使用时间,维护试验环境,保障工作人员健康。 4.1.7 Q0聚焦技术:离子引入部分拥有高压离子聚焦技术,压力至少达7.5mtorr,以确保最佳的离子聚焦效果和离子传输效率,有效消除“记忆效应”和“交叉污染”。 4.1.8 校正方式:外置CDS辅助校正。
韩国现代集团简介 韩国现代集团是韩国最大的多元化综合性财团之一,曾是韩国5大财团之一,世界五百强排名36名,公司总部位于韩国汉城。创始人郑周永从1946年至1951年期间先后创建了现代汽车、现代土建、现代建设等公司,70年代又建立了现代重工业公司,从而使现代集团成为以建筑、造船、汽车行业为主,兼营钢铁、机械、贸易、运输、水泥生产、冶金、金融、电子工业等几十个行业的综合性企业集团。其下属造船业位居全球三强,现代汽车公司是韩国最大的汽车企业,也是世界第八大汽车生产厂家。 现代集团历史 1940年,郑周永在汉城成立了当时罕见的汽车修配厂,这是现代集团最早的雏形。1946年,郑周永开办了“现代汽车修理所”,这是郑周永第一次把“现代”作为一个商业性企业的名称,随后郑又创办了“现代土建社”。 1950年,郑周永将“现代汽车修理所”和“现代土建社”合并为现代建设股份有限公司,从此拉开了创建“现代王朝”的序幕。在家人的协助下,郑周永率领现代集团在韩国创造了一系列让人叹为观止的辉煌:现代集团下面的旗舰企业——现代建设集团是韩国建筑业的第一大企业,在韩国的18座核电站中,有12座是现代建设集团所修建;现代汽车集团,韩国的第一大汽车企业,20世纪70年代,制造出韩国第一辆国产汽车,其蔚山工厂是世界第一大汽车工厂;现代重工集团,是全球最大的造船厂;现代电子是全球第二大芯片制造商…… 1992年,现代集团的销售额占到了韩国整个国民收入的16%,达到惊人的532亿美元,出口额达到87亿美元,占全国出口总量的12%,在韩国的国民经济中举足轻重。下辖的企业达到46家、涉及的领域包括电子、建筑、汽车、钢铁、造船、石化……成为韩国当之无愧的第一企业。 富可敌国 上世纪末的整整10年中,现代集团一直雄踞韩国大企业集团排行榜榜首,鼎盛时期拥有80多个子公司,18万名员工,业务横跨汽车、造船、建筑等数十个行业,总资产高达97万亿韩元(1美元约合1000韩元),年销售额相当于韩国政府全年的预算。即使2000年现代集团分裂,在韩国前30大企业集团中,仍有5家属于现代家族。在韩国近现代经济发展史上,现代集
石钟山记 苏轼 1《水经》云:“彭蠡I 丫之口有石钟山焉(助词,不译)。①郦元以为下临(动词,面对)深潭,微风鼓(名作动,振动)浪,水石相搏(击、拍),声如洪钟。是(这种)说也,人常疑之。今以钟磬qing 置水中,虽大风浪不能鸣(动词使动,使…鸣叫)也,而(递进,更)况石乎!②至唐李渤始(才)访(探寻)其遗踪,得双石于潭上,扣(敲击)而(承接)聆I ing之,南(名作状,在南边的)声函胡(通“含糊”),北(名作状)音清越(高扬),桴f U止响腾(传播),余韵(声音)徐(慢慢地)歇。自以为得(找到)之(代指“命名原因”)矣。然是说也,余尤(更加)疑之。石之铿然有声者(定语后置,“铿然有声”是石的定语),所在皆是(这样)也,而(转折,却)此独以钟名(名作动,命名),何哉译文:《水经》上说:“彭蠡湖的入口处有(一座)石钟山。”①郦道元认为下面对着深潭,微风鼓动着波浪,湖水与山石互相碰撞,发出的声音好像大钟一般。这个说法,人们常常怀疑它。现在拿钟磬放在水中,即使是大风大浪也不能使它发出声响,何况是石头呢!②到了唐朝,李渤才去探寻它的遗迹,在深潭边找到两块山石,敲敲它们,听听它们的声音。南边那块石头的声音重浊而模糊,北边那块石头的声音清脆而响亮,鼓槌停止敲击,声音还在传扬,余音慢慢地消失。他自己认为找到了石钟山命名的原因了。但是这个说法,我更加怀疑。有铿锵悦耳的声音的石头,到处都是这样,可是唯独这座山用“钟” 来命名,为什么呢 一、叙述对石钟山命名的两种说法,然后提出质疑,为下文亲自探究提供依据。 2元丰七年六月丁丑,余自齐安舟(名作状,乘船)行适(到、往)临汝,而(并列)长子迈将赴(赴任)饶之德兴尉,送之至湖口,因得观所谓石钟者。寺僧使小童持斧,于乱石间择其一二扣(敲击)之, 硿硿k e g焉(形副词尾,相当于“然”),余固笑而不信也。至莫(通“暮”)夜月明,(省略主语“吾”)独与迈乘小舟,至绝壁下。①大石侧(名作状,在旁边)立千尺,如猛兽奇鬼,森然欲搏人;而山上栖q I鹘 h u,闻人声亦惊起,磔磔zh e云霄间;.又有若老人咳且笑于山谷中者,或.曰此颧.…gum鹤.he也。余方心动(心惊)欲还,而大声发于水上,噌cheig吰h dig (形容“声音洪亮”)如钟鼓不绝。舟人(船夫)大恐。 ②徐而(修饰,地)察之,则(原来是)山下皆石穴罅(xi d裂缝),不知其浅深(古:偏义复词“深”, 今:浅和深),微波入焉(兼词,那里),涵淡(水波动荡)澎湃(波浪相击)而(表原因)为(形成)此(指“噌吰之声”)也。舟回至两山间,将入港口,有大石当(挡)^流(水流的中心),可坐百人, 空中(中间是空的)而多窍(窟窿),与风水相吞叶,有窾ku?坎k峦(击物声)镗tmg鞳t d (钟鼓声)之声,与向(原先、刚才)之噌吰者相应,如乐作(动词,演奏)焉(助词)。因笑谓迈曰:“汝识(zh i 通“志”)之乎噌吰者,周景王之无射y i也(判断句),竅坎镗鞳者,魏庄子之歌钟也。古之人不余欺也 (宾语前置句)!” 译文:元丰七年六月丁丑日,我从齐安乘船到临汝去,我的长子苏迈将到饶州德兴去做县尉,我送他到湖口,因而能够观察到这座称为“石钟”的山。寺庙里的和尚叫一个小孩拿着斧头,在乱石中间选一两处敲打它,发出硿硿的响声,我本来就觉得可笑,并不相信。到了晚上,月光明亮,我独自与苏迈坐
飞行时间质谱系统 本产品由主机和计算机(含分析软件)组成,其中主机主要由激光器、质量检测器、靶板、真空泵组和开关电源组成。 飞行时间质谱系统Clin-ToF-Ⅱ通过检测生物大分子的分子量,使用蛋白指纹图谱技术,用于对口腔分离的乳酸杆菌、变异链球菌以及白色念珠菌的鉴定。 1.1 产品名称 本仪器全称为飞行时间质谱系统(Clin-ToF-Ⅱ) 1.2 产品型号 1.3 产品结构组成 由主机和计算机(含分析软件)组成,其中主机主要由激光器、质量检测器、靶板、真空泵组和开关电源组成。 2.1外观 外壳应表面整洁,色泽均匀,无伤斑,裂纹等缺陷; 文字和标志应清晰可见;各指示或显示装置应准确清晰; 塑料件应无起泡、开裂、变形以及灌注物溢出现象; 控制和调节机构应灵活可靠,紧固部位应无松动。 2.2技术参数(性能要求) 2.2.1质量测量范围 质谱仪检测离子的质荷比范围为1540Da ~16950Da 。 2.2.2准确度 2.2.2.1内标法 以参考品B完成校对后,参考品A、C的质量漂移应在800ppm内;以参考品D完成校对后,参考品E的质量漂移应在1500ppm内;以参考品F完成校对后,参考品G的质量漂移应在800ppm内。 2.2.2.2外标法 参考品A、B、C、D、E、F、G分别点在靶板上邻近的两点,以其中一点的参考品进行校对,另一点内的参考品质量漂移应在1500ppm内。 2.2.3灵敏度 表示质谱仪在一定信噪比下能够出峰的所需样品量。浓度为10 fmol/μl 的参考品A、浓度为20 fmol/μl的参考品B、浓度为2pmol/μl的参考 品C、浓度为5pmol/μl的参考品D、浓度为10pmol/μl的参考品E条件下,检测参考品A、B、C、D、E,应有信噪比 (S/N) >3的出峰。 2.2.4分辨率 50 < 分辨率 < 3500。 2.2.5重复性 检测参考品A、B、C、D、E物质,重复15次实验,CV<1%。 2.3系统功能
石钟山记 教学目的 1.认识作者反对臆断、重视考察的观点。 2.了解记叙、说明、议论相结合的写法。 教学设想 过去的教学经验证明,将本文当作游记来讲是讲不好的,将苏轼此举上升到“实践精神”,也显得不甚恰当。本文是一篇考察记,开头说作者对郦说和李说的怀疑,正是交代考察的缘起;中间记“游程”也是先访寺僧,后游绝壁,这是为考察目的而安排的;待到考察目的已经达到,便不再提游览之事,而着重抒发议论。按照考察记的要求来安排教学的各个环节,才会显得顺理成章。 本文的教学重点是“余方心动欲还……古之人不余欺也”这一 部分。突出这个重点,可以带动文章的全局。 对“预习提示”中“未能进一步从‘形’的方面作全面考察” 一句要作点解释――苏轼是在六月江水上涨之时去的。不可能看出山形。要防止学生因此引起思想混乱。 本课拟用三课时教读,安排如下: 第1课时:完成练习第一题,诵读第1段。 第2课时:诵读第2段,完成练习第二题。 第3课时:诵读第3段,总结全课。向课外延伸:学生自读俞樾文章(《春在堂随笔》第七卷第17条)。 [说明]练习第三、五两题已在总结课上处理,第四题删去,有关翻译的练习拟放在高中二年级进行。 预习安排 1.对照注释看课文一遍。 2.比较下列各组句子的语气有什么不同,然后朗读全文,要读出语气。 3.划分本文结构。准备口答练习第一题。 第一课时 教学过程
一、导入新课。 提问:这篇课文跟我们刚学过的《游褒禅山记》有相同之点吗?请说出主要的。(都有记游的内容,都有相当多的议论成分,“记” 和“议”又都是紧密地结合在一起的。) 指出:能看出这些相同点,说明同学们能够举一反三,这是阅读能力提高的一个标志。这两篇文章还有一些不同点,而且是很大的不同。这一点现在先不讨论,但同学们在诵读过程中要认真加以领会。现在请看“预习提示”的第2段。 提问:“未能进一步从‘形’的方面作全面考察”这句话是对苏轼的批评吗?(是。)这个批评是不是严了一点? 教师作解释(内容见“教学设想”)后,进一步指出:人们对事物的认识有一个过程,一开始不完善是难免的。苏轼的论断被人们承认八百年之久,这是很了不起的。 二、教师示范背诵全文和学生齐读全文。 要求学生在听教师背诵的过程中给难字注音,并认真品味每句话的语气。 教师背诵完毕,出示小黑板,再次正音: 蠡(lǐ)??(fú)铿(kēng)磔磔(zhézhé) 噌?疲ǎ悖瑷ィ睿纾瑷?ng)罅(xià)?U坎(kuǎ nkǎn) 莫(mù)镗?O(tāngtà)识(zhì)无射(wúyì)指出哪些是通假异读的字(莫、识),哪个字是古音异读(射)。 正音后学生齐读全文。 三、划分结构和探究主旨。 [说明]本文说的是石钟山命名的来由,文中的叙事因此而发,议论也因此而发,用的是卒章显志的写法,全文的结构都是为“显志”服务的。作者的“志”即文章的主旨在最后一段说得十分明白,首先抓住作者的“志”,全文结构就可以一目了然。据此,这一项内容拟采用“倒析法”,也就是从最后一段着手分析,先探究文章主旨。这种分析是纲要式的,目的是使学生获得一个统率全文的初步概念,然后在诵读过程中逐步加深体会。
分子标记技术 摘要:分子标记技术就是利用现代分子生物学基础分析DNA分子特性,并借助 一些统计工具,将不同物种或同一物种的不同类群区分开来,或者将生物体的某些性状与DNA分子特性建立起来的关联关系,已广泛应用于植物遗传与育种研究的众多领域,包括遗传图谱的构建、遗传多样性分析、物种起源与进化、品种资源与纯度鉴定、分子辅助育种等多个方面,具有重大作用。 关键词:分子标记技术原理RFLP RAPD SSR AFLP EST SNP TRAP 分子标记技术应用 引言 分子标记是以个体间遗传物质内核苷酸序列变异为基础的遗传标记,是DNA 水平遗传多态性的直接的反映。与其他几种遗传标记——形态学标记、生物化学标记、细胞学标记相比,DNA分子标记具有的优越性有:大多数分子标记为共显性,对隐性的性状的选择十分便利;基因组变异极其丰富,分子标记的数量几乎是无限的;在生物发育的不同阶段,不同组织的DNA都可用于标记分析;分子标记揭示来自DNA的变异;表现为中性,不影响目标性状的表达,与不良性状无连锁;检测手段简单、迅速。随着分子生物学技术的发展,DNA分子标记技术已有数十种,广泛应用于遗传育种、基因组作图、基因定位、物种亲缘关系鉴别、基因库构建、基因克隆等方面。 一.常用分子标记原理 分子标记技术的种类根据不同的核心技术基础,DNA分子标记技术大致可分为三类: 第一类以Southern杂交为核心, 其代表性技术为RFLP;第二类以PCR 技术为核心,如RAPD、SSR、AFLP、STS、SRAP、TRAP等;第三类以DNA序列(mRNA 或单核苷酸多态性)为核心,其代表性技术为EST标记、SNP标记等。理想的分子标记应达到以下的要求:①具有高的多态性;②共显性遗传;③能够明确辨别等位基因;④分布于整个基因组中;⑤选择中性(即无基因多效性);⑥检测手段简单、快速;⑦开发成本和使用成本尽量低廉;⑧在实验室内和实验室间重复性好。目前,没有任何一种分子标记均满足以上的要求,它们均具有各自的优点和不足。其特点比较见表一。 1.限制性内切酶片段长度多态性标记(Restriction Fragment Length Polymorphism,RFLP) 1974年,Grozdicker 等人鉴定温度敏感表型的腺病毒DNA突变体时,发现了经限制性内切酶酶解后得到的DNA片段产生了差异,由此首创了第一代DNA 分子标记技术——限制性内切酶片段长度多态性标记(RFLP)。其原理是由于不同个体基因型中内切酶位点序列不同(可能由碱基插入、缺失、重组或突变等造成),利用限制性内切酶酶解基因组DNA时,会产生长度不同的DNA酶切片段,通过凝
分子标记概述 遗传标记主要有四种类型: 形态标记(morphological marker)、细胞标记(cytological markers)、生化标记(Biochemical marker)和分子标记(molecular marker)。分子标记是其中非常重要的一种,他是以个体间遗传物质核苷酸序列变异为基础的遗传标记,是DNA 水平遗传多态性的直接的反映。 早在1923年,Sax等就提出利用微效基因与主基因的紧密连锁,对微效基因进行选择的设想。但由于形态标记数目有限,而且许多标记对育种家来说是不利性状,因而难以广泛应用。细胞标记主要依靠染色体核型和带型,数目有限。同工酶标记在过去的二、三十年中得到了广泛的发展与应用。作为基因表达的产物,其结构上的多样性在一定的程度上能反映生物DNA组成上的差异和生物遗传多样性。但由于其为基因表达加工后的产物,仅是DNA 全部多态性的一部分,而且其特异性易受环境条件和发育时期的影响;此外同工酶标记的数量有限,不能满足育种需要。近年来,分子生物学的发展为植物遗传标记提供了一种基于DNA变异的新技术手段,即分子标记技术。 与其它标记方法相比,分子标记具有无比的优越性。它直接以DNA形式出现,在植物体的各个组织、各发育时期均可检测到,不受季节、环境的限制,不存在表达与否的问题;数量极多,基因组变异极其丰富,分子标记的数量几乎是无限的;多态性高,利用大量引物、探针可完成覆盖基因组的分析;表现为中性,即不影响目标性状的表达,与不良性状无必然的连锁;许多标记为共显性,对隐性的性状的选择十分便利,能够鉴别出纯合的基因型与杂合的基因型,提供完整的遗传信息。随着分子生物学技术的发展,现在DNA分子标记技术已有数十种,广泛应用于遗传育种、基因组作图、基因定位、物种亲缘关系鉴别、基因库构建、基因克隆等方面。 分子标记的概念有广义和狭义之分。广义的分子标记是指可遗传的并可检测的DNA序列或蛋白质。蛋白质标记包括种子贮藏蛋白和同工酶(指由一个以上基因位点编码的酶的不同分子形式)及等位酶(指由同一基因位点的不同等位基因编码的酶的不同分子形式)。狭义分子标记是指能反映生物个体或种群间基因组中某种差异的特异性DNA片段。 理想的分子标记必须达以下几个要求:(1) 具有高的多态性;(2) 共显性遗传,即利用分子标记可鉴别二倍体中杂合和纯合基因型;(3) 能明确辨别等位基因;(4) 遍布整个基因组;(5) 除特殊位点的标记外,要求分子标记均匀分布于整个基因组;(6) 选择中性(即无基因多效性);(7) 检测手段简单、快速(如实验程序易自动化);(8) 开发成本和使用成本尽量低廉;(9) 在实验室和实验室间重复性好(便于数据交换)。但是,目前发现的任何一种分子标记均不能满足以所有要求。 分子标记种类 利用分子标记技术分析生物个体之间DNA序列差别并用于作图的研究始于1980年。经过十几年的发展,现在的DNA标记技术已有几十种,主要有一下几大类。
石钟山记 苏轼 1《水经》云:“彭蠡lǐ之口有石钟山焉(助词,不译)。”①郦元以为下临(动词,面对)深潭,微风鼓(名作动,振动)浪,水石相搏(击、拍),声如洪钟。是(这种)说也,人常疑之。今以钟磬qìng 置水中,虽大风浪不能鸣(动词使动,使…鸣叫)也,而(递进,更)况石乎!②至唐李渤始(才)访(探寻)其遗踪,得双石于潭上,扣(敲击)而(承接)聆líng之,南(名作状,在南边的)声函胡(通“含糊”),北(名作状)音清越(高扬),桴fú止响腾(传播),余韵(声音)徐(慢慢地)歇。自以为得(找到)之(代指“命名原因”)矣。然是说也,余尤(更加)疑之。石之铿然有声者(定语后置,“铿然有声”是石的定语),所在皆是(这样)也,而(转折,却)此独以钟名(名作动,命名),何哉? 译文:《水经》上说:“彭蠡湖的入口处有(一座)石钟山。”①郦道元认为下面对着深潭,微风鼓动着波浪,湖水与山石互相碰撞,发出的声音好像大钟一般。这个说法,人们常常怀疑它。现在拿钟磬放在水中,即使是大风大浪也不能使它发出声响,何况是石头呢!②到了唐朝,李渤才去探寻它的遗迹,在深潭边找到两块山石,敲敲它们,听听它们的声音。南边那块石头的声音重浊而模糊,北边那块石头的声音清脆而响亮,鼓槌停止敲击,声音还在传扬,余音慢慢地消失。他自己认为找到了石钟山命名的原因了。但是这个说法,我更加怀疑。有铿锵悦耳的声音的石头,到处都是这样,可是唯独这座山用“钟”来命名,为什么呢? 一、叙述对石钟山命名的两种说法,然后提出质疑,为下文亲自探究提供依据。 2元丰七年六月丁丑,余自齐安舟(名作状,乘船)行适(到、往)临汝,而(并列)长子迈将赴(赴任)饶之德兴尉,送之至湖口,因得观所谓石钟者。寺僧使小童持斧,于乱石间择其一二扣(敲击)之,硿硿kōng焉(形副词尾,相当于“然”),余固笑而不信也。至莫(通“暮”)夜月明,(省略主语“吾”)独与迈乘小舟,至绝壁下。①大石侧(名作状,在旁边)立千尺,如猛兽奇鬼,森然欲搏人;而山上栖q ī鹘hú,闻人声亦惊起,磔磔zhé云霄间;又有若老人咳且笑于山谷中者,或曰此颧guàn鹤hè也。余方心动(心惊)欲还,而大声发于水上,噌chēng吰hóng(形容“声音洪亮”)如钟鼓不绝。舟人(船夫)大恐。②徐而(修饰,地)察之,则(原来是)山下皆石穴罅(xià裂缝),不知其浅深(古:偏义复词“深”,今:浅和深),微波入焉(兼词,那里),涵淡(水波动荡)澎湃(波浪相击)而(表原因)为(形成)此(指“噌吰之声”)也。舟回至两山间,将入港口,有大石当(挡)中流(水流的中心),可坐百人,空中(中间是空的)而多窍(窟窿),与风水相吞吐,有窾kuǎn坎kǎn(击物声)镗tāng鞳tà(钟鼓声)之声,与向(原先、刚才)之噌吰者相应,如乐作(动词,演奏)焉(助词)。因笑谓迈曰:“汝识(zhì通“志”)之乎?噌吰者,周景王之无射yì也(判断句),窾坎镗鞳者,魏庄子之歌钟也。古之人不余欺也(宾语前置句)!”
飞行时间质谱技术及发展 前言:质谱分析是现代物理与化学领域使用的极为重要的工具。目前日益广泛的应用于原子能,石油以及化工,电子,医药等工业生产部门,农业科学研究部门及物理电子与粒子物理,地质学,有机,生物,无机,临床化学,考古,环境监测,空间探索等领域[1]。飞行时间质谱飞行时间质谱仪较其他质谱仪具有灵敏度好、分辨率高、分析速度快、质量检测上限只受离子检测器限制等优点,再配合电喷雾离子源基体辅助激光解析离子源[2]大气压化学电离源等离子源,使之成为当今最有发展前景的质谱仪。飞行时间质谱已用于研究许多国际最前沿的热点问题,是基因及基因组学、蛋白质及蛋白质组学、生物化学、医药学以及病毒学等领域中不可替代的有力工具,例如肽和蛋白分析、细菌分析、药物的裂解研究以及病毒检测。特别是在大通量、分析速度要求快的生物大分子分析中,飞行时间质谱成为唯一可以实现的分析手段,例如与激光离子源联用或作为二维气相色谱的检测器等。本文将介绍飞行时间质谱的基本原理、技术及仪器的发展历程。力求对该仪器技术有一个较清楚的认识,并对今后相关的研究工作提供建设性帮助。 1.飞行时间质谱的工作原理:TOF-MS分析方法的原理非常简单。这种质谱仪的 质量分析器是一个离子漂移管。样品在离子源中离子化后即被电场加速,由离子源产生的离子加速后进入无场漂移管,并以恒定速度飞向离子接收器,假设离子在电场方向上初始位移和初速度都为零,所带电荷数为q,质量数为m, 加速电场的电势差为V, 则加速后其动能应为: m v2 / 2= qe V 其中,v 为离子在电场方向上的速度。 离子以此速度穿过负极板上的栅条,飞向检测器。离子从负极板到达检测器的飞行时间t,就是TOFMS 进行质量分析的判据。在传统的线性TOFMS,离子沿直线飞行到达检测器;而在反射型TOFMS 中,离子经过多电极组成的反射器后反向飞行到达检测器,后者在分辨率方面优于前者。 2.飞行时间质谱的发展: 由于存在初始能量分散的问题,提高飞行时间质谱分辨率一直是研究者和仪器制造上努力的目标。仪器技术的进展也主要围绕这一目标进行。 2.1离子化技术的发展:最初TOFMS采用电子轰击的方法进行离子化。由电子枪产生的电子电离样品分子使其离解为离子,经加速形成离子束进入飞行区。这种方法可用于气、固、液体样品的分析。其缺点是:1)离子化时间较长,和一般离子的飞行时间数量级相近,容易引起大的误差;2)电子的电离及其进样方式,难以进行大分子样品的分析。目前这种离子化方式多用于小分子的分析。而新的电子发生方式如激光电子枪开始出现。后来脉冲离子发生器应用逐步广泛。用于固体或液体样品的重离子轰击、等离子体解吸(PDMS)及二次离子质谱(SIMS)属于此列。目前脉冲激光技术应用最广,包括激光解吸(LD)、共振激光离子化(RI)、共振加强单多光子离子化(RES/MPI)以及生化分析中常用的基质辅助激光解吸[4] (MALDI))等,适用于不同样品的分析。例如共振激光离子化可用于痕量金属元素的分析[3]。REMPI 则擅长复杂有机物的选择性离子化;MALDI的优点在于:1)可获得高的灵敏度,甚至能检测到离子化区的几个原子;2)对于热不稳定的生物大分子可实现无碎片离子化;3)对固体、液体表面分析,可以很好地控制离子化的位置或深度样品,分析时间大大缩短;4)可以与不同的离子化方式相结合。为解决多肽、蛋白、寡糖、DNA测序等生命科学领域中的前沿分析课题,需要发展特殊电离技术以及超高分辨、高灵敏度、大质量范围、多级串联的高档
现代王朝的没落 问题一:现代集团的家族控制有什么特征 1、所有权主要由家族控制。 案例中的现代集团则由郑周永为现代国王的董事长。其有八子一女,其中次子郑梦九担任过现代汽车的总裁,现代精工、现代钢管、现代住宅与工业发展、仁川制铁和现代工业建筑设备公司的董事长;五子郑梦宪担任现代电子的总裁;三子郑梦根负责现代百货;七子郑梦允担任现代海上火灾保险公司顾问;八子郑梦日掌控现代企业金融集团。从以上便可看出现代集团基本上所有权都是有郑氏家族来控制的。 2、企业主要经营管理权掌握在家族成员手中,企业决策家长化 在韩国的现代集团的重大决策都由企业创办人郑周永一人做出,家族其他人员做出的决策也需得到家长的首肯。当企业的领导权传递给第二代或第三代后,其决策权威也同时赋予他们的接班人,其他成员一般也必须服从、接受。 3、经营者激励约束双重化 家族企业中,经营者受到家族利益和亲情的双重激励和约束。对创始人郑周永来说其行为是为了光宗耀祖为子孙后代更好生活。而对家族继承者来说则是发扬父辈留下的事业等是对他们的激励和约束的主要机制。 4、企业员工管理家庭化 家族企业在企业中创造和培育一种家庭式的氛围,使员工产生一种归属感和成就感。 5、来自银行的外部监督很弱 一般来说家族企业都涉及银行业,其中八子郑梦日就掌控着现代的金融集团。银行只是家族企业之一,其必须服从家族的整体利益,所以来自银行的约束基本上是软约束。 6、家族控制集权化,家族控制的权力主要集中在郑周永和郑梦九几个人手中。 问题二:在现代集团的规模十分庞大的情况下,采取家族控制和经营面临什么问题 1、任人唯亲的风险,现代集团日渐强大,主要是他具有企业的凝聚力强、稳定程度高的决策迅速等优点,但这些都是在郑周永家族成员是否具有相应管理才能为条件的。如果他的几个儿子没有管理经营能力,上面的优势不但不会发挥出来而且还会给企业带来经营上的失败。案例中从97年到99年其家族成员的决策不善在亚洲金融风暴中反其道而行导致后面的一直亏损,从而也现代集团带来了前所未有的困境。 2、家族继承的风险,在集团换代之际,由于承接领导权的人得不到家长成员的拥护,易导致成员分类,甚至解体。家庭矛盾渗入企业,考验企业生存案例中现代集团随着郑周永进入暮年,其2子郑梦九和郑梦宪为夺对集团的控制权无声又激烈的斗争着。包括正因为其斗争才导致前面金融风暴的决策错误。最后在2000年8月1日郑梦九有他管理的10家公司和现代汽车正式脱离现代集团,后面接二连三的宣布与现代集团没有瓜葛。最终在2子的不断的斗争下,一步步走向了集团解体的道路。 3、家族企业社会化、公开化程度低。导致运营中只能通过高负债来维持,98年负债660亿元占韩国国内生产总值的40%,后面陆陆续续斥资,导致韩国股市大跌。现代的负债率早已达到百分之几百。最后银行拒绝融资,现代被债权银行所控制,现代集团彻底的交出了对该集团的经营管理权。最终彻底没落。 4、决策不科学,不利于企业的长期生存。案例中金融危机时,现代企业反其道而行地大肆扩张并购,导致公司亏损严重正是因为家族控制的缺点导致的。还有收购起亚,LG半导体部门,不断举债并购而到企业面临巨大危机。正是因为家族控制和经营的独断专行而带