ORIGINAL COMMUNICATION
An evaluation of the sensitivity and speci?city of
energy expenditure measured by heart rate and the Goldberg cut-off for energy intake:basal metabolic rate for identifying mis-reporting of energy intake by adults and children:a retrospective analysis
MBE Livingstone 1*,PJ Robson 1,AE Black 2,WA Coward 3,JMW Wallace 1,MC McKinley 1,JJ Strain 1and PG McKenna 1
1
Northern Ireland Centre for Diet and Health,University of Ulster,Coleraine,Co Londonderry,Northern Ireland,UK;29Birch Close,Cambridge,UK;and 3MRC Human Nutrition Research,Elsie Widdowson Laboratory,Cambridge,UK
Objective :To identify adults and children as under-(UR),acceptable (AR),or over-reporters (OR)of energy intake (EI)using energy expenditure measured by doubly labelled water (DLW)(EE DLW ),and to use this as a reference to determine the sensitivity and speci?city of (i)EE measured by heart rate (EE HR ),and (ii)the Goldberg cut-off technique for classifying subjects into the same categories.
Design :Retrospective analysis of a dataset comprising concurrent measurements of EE DLW ,EE HR ,basal metabolic rate (BMR),and EI by weighed record (EI WR )on 14adults and 36children.EI by diet history (EI DH )was also measured in the children only.EI WR :EE DLW provided the reference de?nition of subjects as UR,AR or OR.Three strategies for classifying mis-reporters based on EE HR and Goldberg cut-offs were then explored.Sensitivity and speci?city were calculated respectively as the proportion of UR and non-UR correctly identi?ed.
Results :Approximately 80%of all subjects were AR.For EI WR and EI DH respectively,the sensitivity of EE HR was 0.50and 1.00,and speci?city was 0.98and 1.00.Although designating subjects as having low,medium or high activity levels (EE HR :BMR meas )and calculating cut-offs based on appropriate WHO physical activity level PALs did not change sensitivity,speci?city dropped to 0.98(EI WR )and 0.97(EI DH ).Cut-offs based on a PAL of 1.55reduced sensitivity to 0.33(EI WR )and 0.00(EI DH ),but speci?city remained unchanged.The sensitivity of all cut-offs based on physical activity level (PALs)for EI WR was 0.50(adults)and 0.25(children).Conclusions :If the precision of EE HR was improved,it may be useful for identifying mis-reporters of EI.
European Journal of Clinical Nutrition (2003)57,455–463.doi:10.1038=sj.ejcn.1601563
Keywords:adults;children;validity;heart-rate;energy;intake;dietary surveys Introduction
The independent validation of energy intake (EI)data by doubly labelled water (DLW)measurements of energy expen-diture (EE)has conclusively demonstrated that systematic under-reporting in dietary surveys,due to under-eating and =or under-recording,is pervasive and is evident across the entire range of energy expenditures (Schoeller,1990;Black et al ,1993;Black,1997,1999).However,while DLW measurements of EE have been paramount in highlighting the existence of bias in dietary surveys,the cost of the technique precludes its routine use in the screening of EI data,particularly in large epidemiological surveys.Reported EI can also be evaluated against presumed energy requirements (Goldberg et al ,1991;Black,2000a).
*Correspondence:Dr MBE Livingstone,Northern Ireland Centre for Diet
and Health,University of Ulster,Coleraine,Co Londonderry,Northern
Ireland,UK.
E-mail:mbe.livingstone@https://www.doczj.com/doc/667769737.html,
Guarantor:Dr MBE Livingstone.
Contributors:MBEL was the principal author and was responsible for
executing the original adult and child cohorts.PJR participated in the
conceptualisation,data analysis,drafting and critical review of the
manuscript.AEB formulated the speci?c hypothesis and critically
reviewed the manuscript.WAC was responsible for over-seeing the
original doubly labelled water analysis and critically reviewed the
manuscript.JMWW,McMcK,JJS and PGMcK participated in
conceptualisation and helped with the drafting and critical review of the
manuscript.
Received 18January 2002;revised 2May 2002;
accepted 17June 2002European Journal of Clinical Nutrition
(2003)57,455–463
?2003Nature Publishing Group All rights reserved 0954–3007/03$25.00
https://www.doczj.com/doc/667769737.html,/ejcn
This procedure,known as the Goldberg cut-off technique,
has demonstrated a widespread tendency to underestimation
in large national dietary surveys from several countries as
well as in many smaller surveys (Heywood et al ,1993;
Fogelholm et al ,1996;Briefel et al ,1997;Lafay et al ,1997;
Price et al ,1997;Pryer et al ,1997;Rothenberg et al ,1997;
Voss et al ,1998).However,this technique was devised to
evaluate the overall bias towards under-reporting at the
group level.Although its use has been extended to identify
under-reporting at the individual level,the cut-off is limited
by low sensitivity,as it only identi?es about 50%of under-
reporters (Black,2000b).Furthermore,it can make no
distinction between varying degrees of mis-reporting.
If the complex nature of biased reporting is to be unra-
velled,and its effects minimized in the analysis of dietary
data,it is vital that individuals who have provided data of
poor validity are identi?ed.To improve sensitivity in the
detection of mis-reporting in dietary surveys,some attempt
should be made to establish values for EE,against which
reported EI can be evaluated.To date,?ve studies have com-
pared reported EI directly with values for EE derived from a
variety of techniques other than EE DLW (Johnson et al ,1994;
de Vries et al ,1994;Ko
¨rtzinger et al ,1997;Charlton &Lambert,1999;Goris &Westerterp,1999).Unfortunately,
the sources of error and bias of these techniques,when used
as validation tools for screening EI data,are unknown.If,as
appears likely,researchers increasingly turn to these more
feasible and cost-effective ways of measuring EE in dietary
surveys,it is vital that their sensitivity and speci?city for
detecting dietary mis-reporting is established at the outset.
The present study examines data from two studies in
adults (Livingstone et al ,1990a,b)and children (Livingstone
et al ,1992a,b)in which EE was measured concurrently by both DLW and HR monitoring.In the same subjects,EI was measured by 7day weighed record (WR;adults and children)and diet history (DH;children only).The present analysis uses the direct comparison of EI and DLW measurements of EE to classify individuals as acceptable,under-or over-reporters (the reference de?nition).The sensitivity and speci-?city of two different strategies for placing individuals into the same categories were then explored:(i)EE measured by HR monitoring;and (ii)Goldberg cut-offs based on PALs for differing intensities of physical activity.Subject and methods The dataset The dataset comprised individual data from four previously published studies of 14free-living adults (Livingstone et al ,1990a,b)and 36children aged 7,9,12,and 15y (Living-stone et al ,1992a,b).The adult subjects were a sub-sample from a large randomly selected community dietary survey,and the children were recruited through schools that were selected to represent the range of socio-economic status.The age distribution and physical characteristics of the subjects are presented in Table 1.These studies were approved by the Queen’s University Ethical Committee (Livingstone et al ,1990a,b)and by the Ethical Committee of the University of Ulster (Livingstone et al ,1992a,b).Energy intake Weighed dietary record.All subjects kept a WR for 7con-secutive days of all individual items of food and ?uid con-sumed,together with the weights of leftovers.Parents of the 7-and 9-y-old children reported the food intakes of their
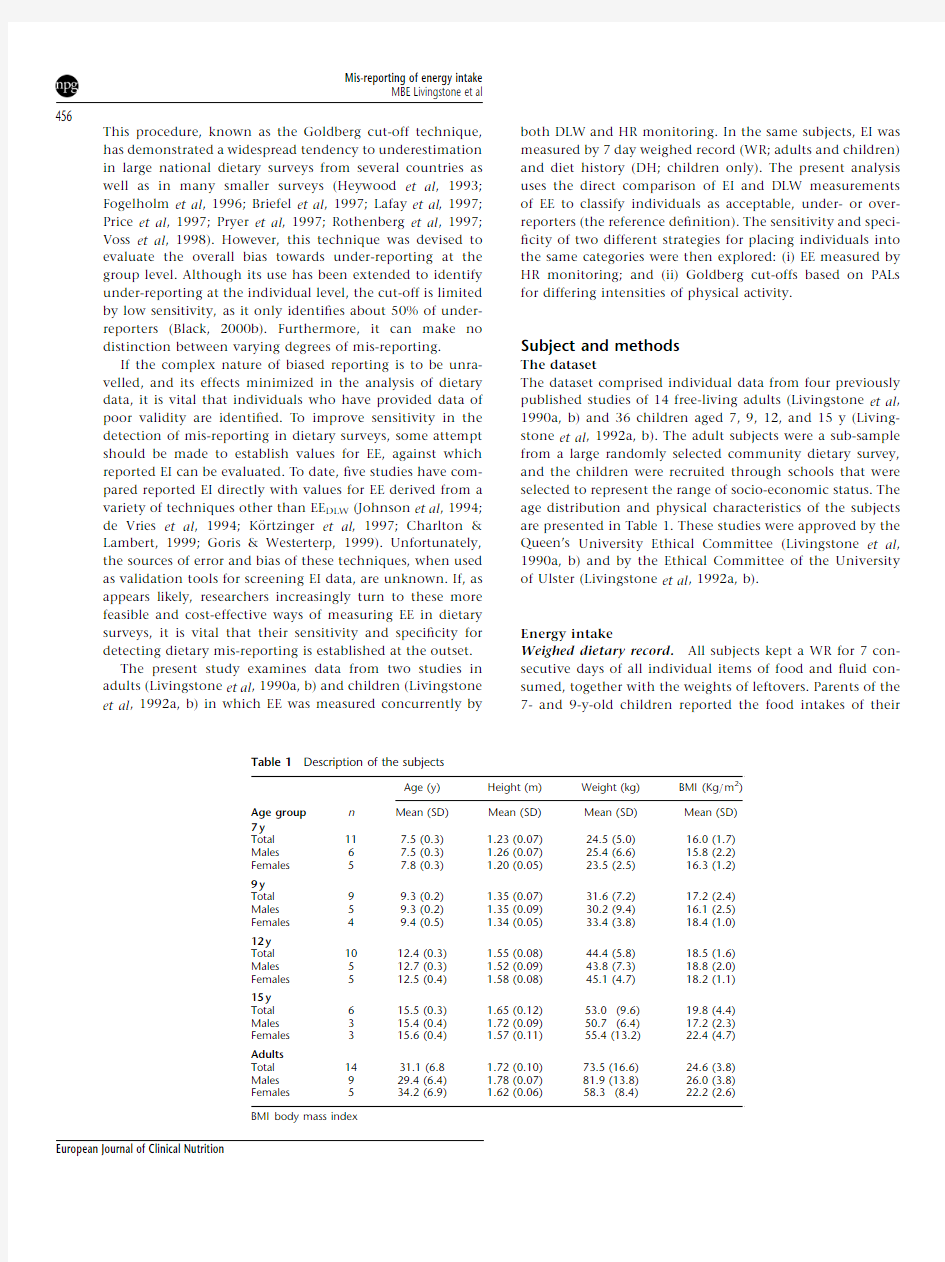
Table 1Description of the subjects
Age (y)
Height (m)Weight (kg)BMI (Kg =m 2)Age group
n Mean (SD)Mean (SD)Mean (SD)Mean (SD)7y
Total
117.5(0.3) 1.23(0.07)24.5(5.0)16.0(1.7)Males
67.5(0.3) 1.26(0.07)25.4(6.6)15.8(2.2)Females
57.8(0.3) 1.20(0.05)23.5(2.5)16.3(1.2)9y
Total
99.3(0.2) 1.35(0.07)31.6(7.2)17.2(2.4)Males
59.3(0.2) 1.35(0.09)30.2(9.4)16.1(2.5)Females
49.4(0.5) 1.34(0.05)33.4(3.8)18.4(1.0)12y
Total
1012.4(0.3) 1.55(0.08)44.4(5.8)18.5(1.6)Males
512.7(0.3) 1.52(0.09)43.8(7.3)18.8(2.0)Females
512.5(0.4) 1.58(0.08)45.1(4.7)18.2(1.1)15y
Total
615.5(0.3) 1.65(0.12)53.0(9.6)19.8(4.4)Males
315.4(0.4) 1.72(0.09)50.7(6.4)17.2(2.3)Females
315.6(0.4) 1.57(0.11)55.4(13.2)22.4(4.7)Adults
Total
1431.1(6.8 1.72(0.10)73.5(16.6)24.6(3.8)Males
929.4(6.4) 1.78(0.07)81.9(13.8)26.0(3.8)Females 534.2(6.9)
1.62(0.06)58.3(8.4)2
2.2(2.6)BMI body mass index
Mis-reporting of energy intake
MBE Livingstone et al
456European Journal of Clinical Nutrition
children while subjects aged12and15y took a greater responsibility for measurement of their own food intake in co-operation with their parents.Subjects were issued with dietary scales,a log book for recording foods and?uids eaten at home,or prepared at home for eating elsewhere,a pocket notebook for recording foods and?uids obtained and eaten away from home,and written instructions which included examples of completed forms.On the day before recording started,each subject was given a detailed explanation and demonstration of the cumulative weighing technique.Sub-jects were instructed to record brand names of foods and to provide a complete description of methods of food prepara-tion and cooking and recipes for composite dishes.The records were used to adjust for losses during cooking.For foods and?uids eaten away from home,a description of the food,place of purchase and price were requested.Subjects were visited on a least four occasions during the weighing period and on the day after completion of weighing to monitor progress and to check log books for completeness and accuracy.The intake of metabolizable energy was calcu-lated from food tables using a computerized data base.
Diet history.The usual food intake of the children only was also assessed by DH interview conducted with the child and=or parent.Potential carryover memory effects between reported EI by diet history(EI DH)and weighed record(EI WR) were minimized by conducting the DH interviews either2–4 weeks before or after the completion of the WR.To eliminate inter-interviewer bias and effects,all interviews were con-ducted by one https://www.doczj.com/doc/667769737.html,rmation was obtained on the usual meal and snack pattern of the subject,including place of consumption,usual foods consumed during the week and on weekends,and detailed descriptions of these foods including methods of preparation and portion size.Amounts of foods and?uids consumed were estimated by means of photographs of known portion weights of foods supplemen-ted with the use of common household cups,glasses and dishes.School meal intakes were assessed by obtaining a typical week’s menu with weights from the school meals staff and asking the child to indicate how much of these meals they usually ate.Self-service school cafeteria meals were assessed by asking the child which foods he or she usually selected and how much they normally ate.Typical portion sizes were subsequently obtained from the supervisory staff. Energy intakes were calculated as described above.Details of each dietary methodology are fully documented in the source references(Livingstone et al,1990b,1992b).
Total energy expenditure
Doubly labelled water method.Total EE by the DLW method was measured over15days in the adults and over 10–15days in the children(Livingstone et al,1990a,b, 1992a,b).The DLW technique,together with methods of calculation,validation studies and estimates of potential errors,has been fully described elsewhere(International Dietary Energy Consultative Group,1990;Speakman, 1997).After collection of a predose urine sample,each subject was dosed orally with0.05g2H2O and0.15g (adults)or0.125g(children)H218O=kg body weight.Aliquot samples of urine were collected5h postdose and each day at
a known time for15days in the adults and10–15days in
the children.Isotope analysis of postdose urine samples was
made in duplicate,corrected for background amounts and carbon dioxide production rate calculated by using the multipoint method(Coward,1988).The mean respiratory quotient required to estimate EE from carbon dioxide pro-duction was calculated from food quotients measured by WR
in the adults and DH in the children(Black et al,1986). Proporation of error analysis yielded an average standard
error for the estimates of EE DLW of6?2.6%(adults)and
2.8?1.0%(children).
Heart-rate monitoring.In all subjects,total EE by the Flex-
HR method was measured over two to four separate days concurrently with the assessment of EE DLW.The procedures
are described in detail in the source references(Livingstone
et al,1990a,1992a).Brie?y,the estimation of EE HR involved measurements of basal metabolic rate(BMR),resting meta-
bolic rate(RMR),individually determined heart rate(HR)–oxygen consumption(VO2)regression lines,and minute-by-minute daytime HR recordings in free-living conditions.To determine the individual HR–VO2regression line,?ve cali-bration points were obtained by simultaneous measurement
of VO2and recording of HR under standardized conditions. Calibration points were obtained for the following activities carried out in sequence:supine,sitting quietly,standing quietly(resting activities)and two exercise activities.HR
was monitored for two to four separate days in the free-
living situation with a cardiofrequency meter(Sport Tester
PE3000;Polar Electro,Kempele,Finland).Daytime HR was recorded at1min intervals up to a maximum recording time
of16h,at which time stored information was retrieved and
the memory reprogrammed.
Twenty-four-hour EE from HR was calculated as follows.A
FLEX HR was calculated as the mean of the highest HR for
the resting activities and the lowest HR of the exercise activities.RMR was calculated as the mean of the VO2for
the resting activities.EE for the16h of HR recording was determined as follows.For periods of the daytime when HR
fell below FLEX HR,EE was calculated as RMR.For the remainder of the time,when HR was above FLEX HR,EE
was derived from the minute-by-minute recorded HR by reference to the subject’s regression line for the VO2corre-sponding to the HR.Twenty-four-hour EE was computed by summing the estimated EE by HR monitoring and EE at night.The latter was assumed to be equal to the measured BMR.
Basal metabolic rate.BMR was measured(BMR meas)by indirect calorimetry using a ventilated hood apparatus (Datex Metabolic Monitor;Datex Instrumentation Corpora-
Mis-reporting of energy intake
MBE Livingstone et al
457
European Journal of Clinical Nutrition
tion,Helsinki,Finland).In the adult subjects,a classical BMR was measured in which subjects spent the previous night in a metabolic laboratory and BMR was measured at1min inter-vals for30–45min under standardised conditions immedi-ately upon waking and with minimal physical disturbance. Children were brought to the laboratory early in the morn-ing in a fasted state and allowed to rest quietly for20min before BMR was measured.BMR was also estimated(BMR est) for each subject from the appropriate Scho?eld equation based on height and weight(Scho?eld et al,1985). Identifying dietary data of poor validity:reference
de?nition
Subjects were identi?ed as acceptable reporters(AR),under-reporters(UR),or over-reporters(OR)from their ratio of EI WR:EE DLW(adults and children)and EI DH:EE DLW(children only),according to whether the individual’s EI:EE ratio was within,below or above the95%con?dence limits of agreement between the two measurements.The95%con-?dence limits of agreement between EI WR or EI DH and EE DLW were calculated as
95%CL??2?eeCV2wEI=dTteCV wEET2T
where d is the number of days of diet assessment and CV wEI and CV wEE are the pooled mean coef?cients of variation in EI (by WR or DH)and EE DLW,respectively.
The CV wEI in EI WR for the adults,for the children and for the total group was27,23and24%,respectively.For the purpose of this analysis,the EI data measured by DH were treated as7day records and assumed to have a pooled mean CV wEI of23%(Bingham,1987;Nelson et al,1989).The coef?cient of variation(CV wEE)for EE DLW was taken as 8.2%(Black&Cole,2000).
This equation de?ned AR by WR as having an EI WR:EE DLW ratio within the range0.74–1.26(adults),0.76–1.24(chil-dren)and0.75–1.25(total group).UR and OR were de?ned as having an EI WR:EE DLW ratio less than or greater than the minimum and maximum values of the appropriate ranges, respectively.AR by DH(children only)were de?ned as having an EI DH:EE DLW ratio in the range0.76–1.24,UR as <0.76and OR as>1.24.
Sensitivity and speci?city
The classi?cation into ar,ur and or,according to the ratios de?ned above,provided the baseline or reference de?nition. Subjects were then classi?ed as acceptable reporters(ar), under-reporters(ur),and over-reporters(or)according to three strategies described below.
1Cut-offs for ar,ur and or were calculated from the95% con?dence limits of agreement between EI WR or EI DH and EE HR.
2Subjects were classi?ed according to their EI:BMR est and EI:BMR meas ratio and the upper and lower cut-offs were calculated by the Goldberg equation for n?1,assuming an energy requirement for a sedentary lifestyle of
1.55?BMR.The principles of the Goldberg cut-off and
the statistical derivation of the equation have been described in detail elsewhere(Goldberg et al,1991;
Black,2000a,b).The revised factors to be used in the equation proposed by Black(2000a,b)were applied in calculating the cut-offs.
3Each subject’s value for EE HR was expressed as the PAL (EE HR:BMR meas)and subjects were allocated to low, medium and high levels of activity as de?ned by the appropriate age–sex physical activity level(PAL)values from the WHO recommended energy requirements (FAO=WHO=UNU,1985).Upper and lower cut-offs were calculated for these individual PAL values using the Gold-berg equation for n?1.
The sensitivity of each of these three strategies for detecting UR was calculated as the proportion of UR correctly identi-?ed,while the speci?city was calculated as the proportion of non-UR correctly identi?ed.The percentage of all subjects mis-classi?ed by each strategy was also calculated. Results
The plots of EI WR(adults and children)and EI DH(children only)against EE DLW are shown in Figures1and2.The dotted lines which indicate the95%con?dence limits of agreement for EI WR:EE DLW(?25%)and EI DH:EE DLW(?24%)provide the reference de?nition of AR,UR and OR by the respective dietary assessment methods.Approximately80%of both adults and children provided acceptable reports of their EI WR,while under-reporting(14%adults;11%children) was more prevalent than https://www.doczj.com/doc/667769737.html,parison of mis-reporting by WR and DH(children only)shows that over-reporting was more prevalent by DH(17%DH vs6% WR),while under-reporting was more prevalent by WR(11% WR vs3%DH)(Table2).
Table3shows the sensitivity and speci?city of the?rst strategy for evaluating reported EI,namely a direct
compar-
Mis-reporting of energy intake
MBE Livingstone et al
458
European Journal of Clinical Nutrition
ison of EI with EE measured by HR monitoring.It shows the
number of AR,UR and OR,as de ?ned by EI WR :EE DLW or
EI DH :EE DLW ,falling into each category of acceptable,under-
and over-reporters (designated by,ar ,ur and or )as assessed by
EI WR :EE HR or EI DH :EE HR .The numbers in brackets are subjects who have been mis-classi ?ed.The major impact of the wider 95%con ?dence limits of agreement for EI WR :EE HR ,com-pared with EI WR :EE DLW ,was to reduce the apparent extent of under-reporting by 50%in both adults and children.However,the speci ?city of EE HR for identifying non-UR by WR was good,with only one adult subject and none of the children being misclassi ?ed as a ur rather than an ar .On the other hand,the sensitivity and speci ?city of EE HR for identi-fying both UR and non-UR by DH (children only)were excellent.When cut-offs based on a blanket PAL of 1.55were applied to the EI WR data,speci ?city also remained high (1.00adults;0.97children)for cut-offs based on BMR est and was perfect (1.00)when based on BMR meas (Table 4).The sensitivity of this strategy in the adult subjects was similar to that of EE HR ,with only 50%of subjects who under-reported by WR being correctly identi ?ed.However,sensitivity of the cut-offs was particularly poor when applied to the EI reports of the children.Only 25%of the children who under-reported by WR and none of the UR by DH were correctly identi ?ed using this strategy.In the third strategy,the subjects were assigned to low,medium and high activity levels according to their own Table 2...of EI WR or DH
and EE DLW Weighed dietary record (WR)
Diet history (DH)Children
Adults Total Children Reporting category
n %n %n %n %Acceptable reporters (AR)
3083.31285.74284.02980.6Over-reporters (OR)
2 5.600.02 4.0616.7Under-reporters (UR)
411.1214.3612.01 2.8Total 36100.014100.050
100.036100.0The numbers of subjects classi ?ed as acceptable-,over-,and under-reporters (AR,OR,UR)by the direct comparison of EI WR
or DH and EE DLW
Table 3The numbers of UR,AR and OR as de ?ned by the reference of EI WR or DH :EE DLW and as classi ?ed by EI WR or DH :EE HR
Reference clasisication by EI:EE DLW
UR AR
OR Classi ?cation by EI:EE HR
Lower cut-off
Upper cut-off ur ar ur ar or ar or Mis-classi ?ed (%)Sensitivity Speci ?city EI WR :EE HR
Total group (n ?50)
0.68 1.323(3)(1)40(1)(1)1120.500.98Adults (n ?14)
0.60 1.401(1)(1)11000140.500.92Children (n ?36)
0.72 1.282(2)029(1)(1)1110.50 1.00EI DH :EE HR
Children (n ?36)0.72 1.2810028(1)063 1.00 1.00UR and ur ,under-reporters;AR and ar ,acceptable reporters;OR and or ,over-reporters.
EI,energy intake;EE,energy expenditure,DLW,doubly labelled water;HR,heart rate monitoring;WR,weighed record;DH,diet history.
Numbers in brackets are mis-classi ?ed
subjects.
Mis-reporting of energy intake
MBE Livingstone et al
459European Journal of Clinical Nutrition
measured PAL (EE HR :BMR meas ).Table 5presents the WHO
PAL values for the three activity levels for each age –sex
group and the boundaries selected for assigning subjects to
each level (the midpoints between the WHO PAL values).
Table 6shows the effect of applying the upper and lower cut-offs based on these PAL values to scrutinize the EI data.Only data based on BMR est are presented,as the sensitivity and speci ?city were not improved by calculations based on BMR meas .Relative to the use of cut-offs based on a single measured PAL of 1.55,the application of cut-offs based on the PALs of the subjects did not alter the proportion of adults or children who were mis-classi ?ed.However,they were fully sensitive to the extent of under-reporting by WR in the adult subjects,albeit there was some loss of speci ?city.In contrast,while the cut-offs based on activity levels offered no improvement in sensitivity (0.25)when applied to the EI WR of the children,they were fully sensitive to correctly identifying UR by DH.Discussion At the outset it is acknowledged that the small study sample used in this analysis precludes any de ?nitive conclusions concerning the ef ?cacy of EE HR as an independent validity check on mis-reporting of EI data.Unfortunately,the expense and other problems of conducting such validation studies will inevitably constrain the numbers that can be studied,and hence,the generality of the conclusions for dietary surveys.The merit of this analysis lies in drawing attention to the possible pitfalls that could arise when applying validation techniques of unknown sensitivity and speci ?city for detecting mis-reporting of EI.
With this caveat in mind,the results of this retrospective
study on randomly selected subjects demonstrated that EE HR Table 4The numbers of UR,AR and OR as de ?ned by the reference EI WR or DH :EE DLW and as classi ?ed by EI:BMR using a blanket PAL of
1.55and either a measured or estimated BMR to calculate the Goldberg cut-off
Reference clasisication by EI:EE DLW
UR AR
OR Classi ?cation by EI:BMR
Lower cut-off
Upper cut-off ur ar ur ar or ar or Mis-classi ?ed (%)Sensitivity Speci ?city EI WR :BMR est
Total group (n ?50)
1.05
2.292(4)(1)41002100.330.98Adults (n ?14)
1.04
2.311(1)01200070.50 1.00Children (n ?36)
1.05
2.291(3)(1)29002110.250.97EI WR :BMR meas
Total group (n ?50)
1.08
2.232(4)041(1)(1)1120.33 1.00Adults (n ?14)
1.07
2.241(1)01200070.50 1.00Children (n ?36)
1.08
2.221(3)029(1)02110.25 1.00EI DH :BMR est
Children (n ?36)
1.05
2.280(1)027(2)0680.00 1.00EI DH :BMR meas
Children (n ?36) 1.09 2.210(1)27(2)(1)5110.00 1.00UR and ur ,under-reporters;AR and ar ,acceptable reporters;OR and or ,over-reporters.
EI,energy intake;EE,energy expenditure,DLW,doubly labelled water;BMR,basal metabolic rate;WR,weighed record;DH,diet history.Numbers in brackets are mis-classi ?ed subjects.
Table 5Activity levels and PAL ranges for low,medium and high
activity levels for each age –sex group
Subjects
PAL a Activity level PAL range b Adult males 1.55
Low <1.6651.78
Medium 1.665–1.942.10
Heavy >1.94Adult females 1.56
Low <1.601.64
Medium 1.60–1.731.82
Heavy >1.737-,9-and 12-y-old males 1.54
Low <1.6451.75
Medium 1.645–1.8551.96
Heavy >1.8557-,9-and 12-y-old females 1.48
Low <1.581.68
Medium 1.58–1.781.88
Heavy >1.7815-y-old males 1.6
Low <1.711.82
Medium 1.71–1.932.04
Heavy >1.9315-y-old females 1.46
Low <1.561.66
Medium 1.56–1.761.86Heavy >1.76a PAL (physical activity level)values taken from FAO =WHO =UNU (1985).b Boundaries calculated as the mid-points of FAO =WHO =UNU (1985)values.
Mis-reporting of energy intake
MBE Livingstone et al
460
European Journal of Clinical Nutrition
had only half the sensitivity of EE DLW for detecting UR by
WR,although its speci ?city remained largely uncompro-
mised.Relative to EE DLW ,EE HR was equally effective for
detecting UR and non-UR by the DH method (children
only).The loss of sensitivity for screening EI WR can be largely
attributed to the higher within-subject coef ?cient of varia-
tion in the measurements of EE by HR monitoring (13.3,
17.6,11.2%for the total group,adults and children respec-
tively)relative to DLW,which was taken as 8.2%(Black &
Cole,2000).In the original studies (Livingstone et al ,1990a,
1992a),EE HR and EE DLW showed good agreement at the
group level,but individual estimates of EE HR ranged from
722to t52%of corresponding EE DLW values.The reasons
for these discrepancies have been discussed in detail in the
source references (Livingstone et al ,1990a,1992a)and
include limited sampling periods for the estimation of
HR EE ,inappropriate Flex-HR de ?nition and =or unrepresenta-
tive calibration data.In particular,it is most unlikely that 2–
4days of EE HR ,as was measured in these subjects,would
provide a representative estimate of habitual EE HR .Undoubt-
edly,the CV wEE would be reduced and the sensitivity of the
method enhanced,if the precision of HR monitoring could
be improved.
Inevitably,more lengthy periods of EE HR assessment
would have practical and resource implications for research-
ers who intend to exploit this methodology as a validation
tool.However,failure to extend the assessment periods
would mean that EE HR would offer little advantage over
the original Goldberg equation based on a blanket PAL of
1.55.Another constraint associated with estimating EE HR is
the requirement for individual calibration of HR vs VO 2,
necessitating appropriate metabolic facilities for measuring
respiratory gas exchange.Thus,assessment of EE HR for
screening EI in large dietary surveys may simply not be a
viable option.However,with the proviso that representative
measures of EE HR must be obtained to maximize sensitivity,the method could prove an extremely effective validation tool in small studies where individual data have much greater in ?uence on the results and conclusions (Black et al ,1997).An alternative application of HR monitoring,more suited to larger population samples,is to dispense with the assess-ment of EE HR in favour of simply de ?ning patterns of physical activity as low,medium or high.In default,subjects in this analysis were classi ?ed into their respective activity levels based on a comparison of their measured EE HR :BMR-meas ratio with WHO PALs since this is a better measure of ‘true ’activity level as measured by HR.Overall,this strategy proved as sensitive for screening EI WR data as that based on individual measurements of EE HR and more sensitive than that based on a blanket PAL of 1.55.Nevertheless,it is apparent that cut-offs based on activity levels are of differ-ential sensitivity,given that they identi ?ed all of the adult UR but 75%of the children who under-reported by WR went undetected.Clearly,the ef ?cacy of this strategy hinges on being able to select a suitable PAL value for each activity level.Even then,differences in sensitivity will emerge depending on the extent to which a selected PAL at any one level is close to the true value.For example,the actual mean EE HR :BMR meas of the adult subjects assigned to each activity level were 1.42,1.68and 2.30for the men and 1.56,1.65and 1.78for women while the corresponding WHO PAL values used to derive the cut-offs were 1.55,1.78and 2.10(men),and 1.56,1.64and 1.80(women).Fortuitously,these cut-offs proved to be fully sensitive in the adult group but the penalty was a reduced speci ?city.Even if subjects can be correctly classi ?ed into their respective activity levels,the application of a single cut-off to encompass the range of EE within a given activity level will vary the probability between subjects that they will be (mis)classi ?ed as a UR,AR or OR.Consequently,while the cut-offs based on the physical activity levels clearly have more merit than those
Table 6The numbers of UR,AR and OR as de ?ned by the gold standard EI WR or DH :EE DLW and as classi ?ed by the cut-off for EI:BMR est using values for low,medium and high activity (calculated from EE HR :BMR meas )as the reference PAL
Clasisication by EI:EE DLW
UR AR
OR Classi ?cation by EI:BMR est
ur
ar ur ar or ar or Mis-classi ?ed (%)Sensitivity Speci ?city EI WR :BMR est
Total group (n ?50)
3(3)(1)410(1)(1)100.500.98Adults (n ?14)
20(1)110007 1.000.92Children (n ?36)
1(3)0300(1)(1)110.25 1.00EI DH :BMR est
Children (n ?36)10(1)27(1)(1)(5)8 1.000.97UR and ur ,under-reporters;AR and ar ,acceptable reporters;OR and or ,over-reporters.
EI,energy intake;EE,energy expenditure,DLW,doubly labelled water;BMR,basal metabolic rate;PAL,physical activity level;WR,weighed record;DH,diet history.
Numbers in brackets are mis-classi ?ed subjects.
Mis-reporting of energy intake
MBE Livingstone et al
461
European Journal of Clinical Nutrition
based on a blanket cut-off of1.55,and should be used in preference,it is with the caveat that they are most unlikely to ful?ll the criterion of full sensitivity as shown in this small sample of adults.
The differential sensitivity of cut-offs is particularly well exempli?ed in the dietary reports of the children. Most attempts at identifying mis-reporting of EI by children have applied the same strategies as those used to scrutinize the EI data of adults.Intuitively this seems logical,but as the present analysis has shown,there are inherent problems in doing so.Of the strategies explored,EE HR was the most sensitive and speci?c indicator of mis-reporting by WR in children and it is reasonable to assume that the detection of UR would improve if due cognisance was taken of the need to obtain more representative estimates of EE HR.The use of cut-offs based on a blanket PAL of 1.55and physical activity levels was much more problematic because application of each of these strategies was only sensitive to25%of UR by EI WR,even though their speci?city was perfect.It is perhaps not surprising that cut-offs based on a blanket PAL of 1.55 were so insensitive for evaluating the EI WR in a paediatric population.A PAL of1.55was originally devised to evaluate the overall bias to under-reporting in a sedentary adult population,although in theory the cut-off values for a sample size of n?1can be used to identify UR at the individual level(Goldberg et al,1991;Black,2000a,b). Consequently,its application for identifying individual mis-reporters in paediatric groups cannot be advocated. Of equal concern is that application of age-sex speci?c cut-offs based on three levels of physical activity did not improve the sensitivity of the technique,suggesting that the WHO recommended PAL levels for these age-sex-activity groups may be inappropriate for this purpose (Torun et al,1996).In the present state of knowledge, therefore,all cut-offs based on assumed PAL levels used for screening the EI data of children should be applied with caution and with full acknowledgement of the pitfalls involved.
There is some evidence from these data to suggest that EE HR and cut-offs based on physical activity levels may be more sensitive in detecting UR by EI DH.In marked contrast,a cut-off based on a PAL of1.55was totally insensitive to EI DH under-reporting.However,EI DH was assessed only in the children and,as this analysis shows,the issue with these data was of over-reporting,not under-reporting.Therefore,no conclu-sions about the ef?cacy of these strategies for detecting UR by DH in this,or any other group,could be justi?ed at present.
The?nal issue is whether sensitivity and speci?city of cut-offs based on assumed PAL values would be improved if BMR was not estimated but measured directly.The data presented in Table4show no differences in the sensitivities based on BMR est or BMR meas,although the detection of non-UR was marginally improved.Therefore,any advantages of BMR meas, relative to the resource implications of making such mea-surements,do not justify inclusion of BMR meas in large epidemiological studies.However,BMR meas in small-scale studies could help to avoid misclassi?cation of subjects (Black et al,1997).
The identi?cation of mis-reporters of EI at the individual level must underpin any attempt to assess the causes and consequences of mis-reporting in dietary surveys.This is a formidable challenge which can only be addressed by direct comparison of EI with EE,or in default,by using cut-offs for EI:BMR based on the physical activity level of individual subjects.However,as this analysis has shown,currently available techniques such as EE HR may be able to identify only gross bias.The implications are salutary.Before any technique for estimating EE comes into common use for validating EI,its sensitivity and speci?city for detecting mis-reporters needs to be carefully evaluated,not just assumed. Otherwise,indiscriminate use of instruments of unknown sensitivity and speci?city will only generate more confusion in an already confused area.
Acknowledgements
We thank the subjects who took part in these studies. References
Bingham S(1987):The dietary assessment of individuals;methods, accuracy,new techniques and recommendations.Nutr.Abstr.Rev.
57,705–742.
Black AE,Prentice AM,Goldberg GR,Jebb SA,Bingham SA,Living-stone MBE and Coward WA(1993):Measurements of total energy expenditure provide insights into the validity of dietary measure-ments of energy intake.J.Am.Diet.Assoc.93,572–579.
Black AE(1997):Under-reporting of energy intake at all levels of energy expenditure:evidence from doubly labelled water studies.
Proc.Nutr.Soc.56,121A.
Black AE(1999):Small eaters or under-reporters?In Progress in Obesity Research,ed.G Ailhaud&B Guy-Grand pp223–228.Paris:John Libbey.
Black AE(2000a):Critical evaluation of energy intake using the Goldberg cut-off for energy intake:basal metabolic rate.A prac-tical guide to its calculation,use and limitations.Int.J.Obes.Relat.
Metab.Disord.24,1119–1130.
Black AE(2000b):The sensitivity and speci?city of the Goldberg cut-off for EI:BMR for identifying diet reports of poor validity.Eur.J.
Clin.Nutr.54,395–404.
Black AE&Cole TJ(2000):Within-and between-subject variation in energy expenditure measured by doubly-labelled water technique: implications for validating reported dietary energy intake.Eur.J.
Clin.Nutr.54,386–394.
Black AE,Prentice AM and Coward WA(1986):Use of food quotients to predict respiratory quotients for the doubly-labelled water method of measuring energy expenditure.Hum.Nutr.Clin.Nutr.
40C,381–391.
Black AE,Bingham SA,Johansson G&Coward WA(1997):Validation of dietary intakes of protein and energy against24hour urinary N and DLW energy expenditure in middle aged women and retired men:comparison with validation against presumed energy requirements.Eur.J.Clin.Nutr.51,405–413.
Briefel RR,Sempos CT,McDowell MA,Chien S&Alaimo K(1997): Dietary methods research in the third National Health and Nutri-tion Examination Survey:under-reporting of energy intake.Am.J.
Clin.Nutr.65,S1203–S1209.
Charlton KE&Lambert EV(1999):Validation of a food frequency questionnaire in older South Africans.S.A.Med.J.89,184–189. Coward WA(1988):The doubly-labelled-water(2H218O)method: principles and practice.Proc.Nutr.Soc.47,209–218.
Mis-reporting of energy intake
MBE Livingstone et al
462
European Journal of Clinical Nutrition
de Vries JH,Zock PL,Mensink RP,Katan MB(1994):Underestimation of energy intake by3-d records compared with energy intake to maintain body weight in269nonobese adults.Am.J.Clin.Nutr.
60,855–860.
FAO=WHO=UNU(1985):University.Report of a joint expert consulta-tion.Energy and protein requirements.WHO Technical Report Series no.724Geneva:WHO.
Fogelholm M,Ma¨nnisto S,Vartiainen E&Pietinen P(1996):Deter-minants of energy balance and overweight in Finland1982and 1992.Int.J.Obes.Relat.Metab.Disord.20,1097–1104. Goldberg GR,Black AE,Jebb SA,Cole TJ,Murgatroyd PR,Coward WA &Prentice AM(1991):Critical evaluation of energy intake data using fundamental principles of energy physiology.1.Derivation of cut-off values to identify under-recording.Eur.J.Clin.Nutr.45, 569–581.
Goris AHC&Westerterp KR(1999):Underreporting of habitual food intake is explained by undereating in highly motivated lean women.J.Nutr.129,878–882.
Heywood P,Harvey PJW&Marks GC(1993):An evaluation of energy intake in the1983Australian National Dietary Survey of Adults.
Eur.J.Clin.Nutr.47,604–606.
International Dietary Energy Consultative Group(IDECG)(1990).
The doubly-labelled water method for measuring energy expendi-ture:technical recommendations for human applications,ed.AM Prentice.Vienna:IAEA=IDECG NAHRES-4.
Johnson RK,Goran MI&Poehlman ET(1994):Correlates of over-and underreporting of energy intake in healthy older men and women.Am.J.Clin.Nutr.59,1286–1290.
Ko¨rtzinger I,Bierwag A,Mast M&Mu¨ller MJ(1997):Measurements of energy intake using a7-day dietary record and a diet history in non-obese subjects.Ann.Nutr.Metab.41,37–44.
Lafay L,Basdevant A,Charles M-A,Vray M,Balkau B,Borys J-M, Eschwege E&Romon M(1997):Determinants and nature of dietary underreporting in a free-living population:the Fleurbaix Laventie Ville-Sante′(FLVS)Study.Int.J.Obes.Relat.Metab.Disord.
27,567–573.
Livingstone MBE,Prentice AM,Coward WA,Ceesay SM,Strain JJ, Mckenna PG,Nevin GB,Barker ME&Hickey RJ(1990a):Simulta-neous measurement of free-living energy expenditure by the doubly labeled water method and heart-rate monitoring.Am.J.
Clin.Nutr.52,59–65.Livingstone MBE,Prentice AM,Strain JJ,Coward JJ,Black AE,Barker ME,McKenna PG&Whitehead RG(1990b):Accuracy of weighed
dietary records in studies of diet and health.Br.Med.J.300,708–
712.
Livingstone MBE,Coward WA,Prentice AM,Davies PSW,Strain JJ, McKenna PG,Mahoney CA,White JA,Stewart CM&Kerr MJ
(1992a):Daily energy expenditure in free-living children:compar-
ison of heart-rate monitoring with the doubly labeled water
(2H218O)method.Am.J.Clin.Nutr.56,343–352.
Livingstone MBE,Prentice AM,Coward WA,Strain JJ,Black AE, Davies PSW,Stewart CM,McKenna PG&Whitehead RG
(1992b):Validation of estimates of energy intake and diet
history in children and adolescents.Am.J.Clin.Nutr.56,29–
35.
Nelson M,Black AE,Morris JA&Cole TJ(1989):Between-and within-subject variation in nutrient intake from infancy to old
age:estimating the number of days required to rank dietary intake
with desired precision.Am.J.Clin.Nutr.50,156–167.
Price GM,Paul AA,Cole TJ&Wadsworth MEJ(1997):Characteristics of the low-energy reporters in a longitudinal national dietary
survey.Br.J.Nutr.77,833–851.
Pryer J,Vrijheid M,Nichols R,Kiggins M&Elliott P(1997):Who are the’Low energy reporters’in the dietary and nutritional survey of
British adults?Int.J.Epidemiol.26,146–154.
Rothenberg E,Bosaeus I&Steen B(1997):Evaluation of energy intake estimated by a diet history in three free-living70year old
populations in Gothenburg,Sweden.Eur.J.Clin.Nutr.51,60–66. Schoeller DA(1990):How accurate is self-reported dietary energy intake?Nutr.Rev.48,373–379.
Scho?eld WN,Scho?eld C&James WPT(1985):Basal metabolic rate.
Hum.Nutr.Clin.Nutr.39C(Suppl1),S1–S96.
Speakman JR(1997):Doubly Labelled Water:Theory and Practice.
London:Chapman and Hall.
Torun B,Davies PSW,Livingstone MBE,Paolisso M,Sackett,&Spurr GB(1996):Energy requirements and dietary energy recommenda-
tions for children and adolescents1to18years.Eur.J.Clin.Nutr.
50(Suppl1),S37–S81.
Voss S,Kroke A,Klipstein-Grobusch K,Boeing H(1997):Obesity as a major determinant of underreporting in a self-administered food
frequency questionnaire:results from the EPIC-Potsdam Study.Z.
Ernahrungswiss.36,229–236.
Mis-reporting of energy intake
MBE Livingstone et al
463
European Journal of Clinical Nutrition