Interpretation of channelized architecture using three-dimensional photo real models,Pennsylvanian deep-water deposits at Big Rock Quarry,Arkansas q
M.I.Olariu a ,*,C.L.V.Aiken b ,J.P.Bhattacharya c ,X.Xu d
a
University of Texas at Austin,Department of Geological Sciences,Austin,TX,USA
b
University of Texas at Dallas,800West Campbell Road,Richardson,TX 75080-3021,USA c
University of Houston,4800Calhoun Road,Houston,TX 77004,USA d
REAL EARTH MODELS,LLC,Dallas,TX,USA
a r t i c l e i n f o
Article history:
Received 5August 2010Received in revised form 30November 2010
Accepted 21December 2010
Available online 28December 2010Keywords:
Turbidite architecture Jackfork group Slope channel LIDAR
3-D photo real model
a b s t r a c t
Mapping geological details and interpreting three-dimensional geometries in a highly heterogeneous outcrop such as the exposure at Big Rock Quarry has been a continuous challenge especially because high vertical cliffs make access to most of the rocks dif ?cult for direct geological observations.Previous interpretations of facies architecture were derived from gamma e ray pro ?les,a core and measurements made on two-dimensional photomosaics.This paper represents the ?rst attempt of three-dimensional interpretation of the geometry and facies pattern of the Jackfork nested channel complex deposited at the base-of-slope.
Examination of the photo real model of the outcrop with assigned lithologies allowed extraction of accurate 3-D qualitative,as well as quantitative (channel dimensions)geometric information.This facilitated interpretation and reconstruction of the submarine channel complex architecture making possible correlations of strata exposed on the two sides of the quarry.
Most of the exposed vertically and laterally stacked channels are large,aggradational with well-de ?ned axial regions overlain by matrix-supported breccia which grades upward into amalgamated sandstones.The thickness of the sandstone decreases toward the southeastern end of the quarry where more shale is present.The channel in ?ll consists of thin-bedded sandstones interlayered with shale which overlain the breccia.The upper part of the quarry is made up of smaller,lateral migrating channels.
Signi ?cant channel width and thickness variation can be recognized at outcrop scale.Thirty-eight identi ?ed channels are characterized by a relatively low aspect ratio (4:1to 32:1)with channel dimensions ranging from 25m to 314m wide and 2m e 24m deep.Bed thickness distributions of various facies show that the sandstone comprises a signi ?cant proportion (83%)of the total channel thickness,while shale and breccia represent about 8%,and 17%respectively.This yields a high net-to gross ratio of more than 80%.
Compared to previous reconstructions our 3-D photo real model is more accurate and it can be used to calibrate simulation of processes in deep-water environments.
ó2011Elsevier Ltd.All rights reserved.
1.Introduction
Understanding the depositional processes and lateral geometry of deep-water base of the slope systems is important for predicting the extent and internal architecture of these reservoirs (Bouma
et al.,1995;Slatt et al.,2000).Adequate documentation of reser-voir properties and ?ow behavior at reservoir scale requires infor-mation about heterogeneity at a sub meter scale in three dimensions.However,it is dif ?cult to include realistic distributions of shale and sandstone bodies in reservoir models because of the wide spacing of wells and limited vertical resolution of seismic surveys.One solution is to characterize shale-sandstone distribu-tion using data from large,continuous three-dimensional outcrops (Coleman et al.,2000;Slatt,2000).Accurate mapping of the architecture of these reservoirs requires interpretation of erosional and depositional geometries preserved in outcrops.
q The work presented in this paper has been done at the University of Texas at Dallas.
*Corresponding author.
E-mail addresses:iolariu@https://www.doczj.com/doc/6510050911.html, (M.I.Olariu),aiken@https://www.doczj.com/doc/6510050911.html, (C.L.V.Aiken),jpbhattacharya@https://www.doczj.com/doc/6510050911.html, (J.P.
Bhattacharya).
Contents lists available at ScienceDirect
Marine and Petroleum Geology
journal h omepage:ww w.elsevi https://www.doczj.com/doc/6510050911.html,/locate/marp
etgeo
0264-8172/$e see front matter ó2011Elsevier Ltd.All rights reserved.doi:10.1016/j.marpetgeo.2010.12.007
Marine and Petroleum Geology 28(2011)1157e 1170
Channelized facies of the Pennsylvanian Jackfork sandstone exposed at Big Rock Quarry in Arkansas have long been contro-versial.Originally thought to be ?uvial (Taff,1902)it is now widely agreed to be submarine,although there is still debate about what kind of processes generated it (debris ?ows,slumps,high vs.low-density turbidity ?ows)and what submarine settings they should be assigned to (upper canyon slope vs.base-of-slope).Also the geometry of these deposits was dif ?cult to interpret due to high variability of bed thicknesses and lateral discontinuities in three dimensions.
Previous facies interpretation was derived from gamma-ray pro ?les (Jordan et al.,1993),a core drilled about 15m behind the outcrop face (Link and Stone,1986)and from direct geological observations where the outcrop was easily accessible.Measurements on large photographic prints (Cook,1993;Bouma and Cook,1994)facilitated statistical characterization of width and thickness dimen-sions,as well as reconstruction of facies architecture.The three gamma pro ?les taken at this site illustrated potential problems inwell log correlations of laterally discontinuous strata.When comparing information from well logs and cores it was obvious that some of the thinner beds could not be identi ?ed on the gamma-ray pro ?les since they are below the resolution of the logging tools.Cores provide the necessary resolution for distinguishing these features,but unfortu-nately there is only one core taken at this site.Also two-dimensional photomosaic interpretations are not effective tools in correlation of strata with a complicated three-dimensional geometry.
Understanding of turbiditic systems has improved with the use of high-resolution shallow 2-D and 3-D seismic data,but the detailed internal architecture of these reservoirs below seismic resolution remains uncertain.Seismic modeling of Big Rock Quarry outcrop indicated that internal sand-body architecture and geom-etry may not be clearly imageable with conventional seismic pro ?ling (Coleman et al.,2000)mostly due to the cemented nature of the sediments,providing little or no acoustic impedance contrast between sedimentary intervals.These rocks have been subjected to low grade metamorphism (close to green schist)which is respon-sible for their increased brittleness and cemented nature.
Big Rock Quarry has a horseshoe shape which makes it a good candidate for three-dimensional imaging and interpretation.Facies architecture and dimensions of channel sandstones are highly
anisotropic (width/length/depth).As a consequence it is critical to know how outcrops are oriented within depositional strike/dip to make meaningful quantitative analysis of sand-body dimensions.Conventional outcrop analogs are hampered by the 2-D nature of data sets and the inability to overcome or moreover to take advantage of https://www.doczj.com/doc/6510050911.html,pared to previous two-dimensional outcrop photomosaics,the three-dimensional photo real model adds more valuable information for outcrop interpretation (Bhattacharya et al.,2002;Aiken et al.,2004).Photo real models of outcrops are created using a combination of high-resolution terrestrial laser scanners,real-time kinematic global positioning system and digital photos to capture the 3-D topography and spatial geometry of an outcrop in a digital format.
In this study we use innovative 3-D methods to generate accu-rate dimensional data that represent true dip/strike orientation.These dimensions are compared to those derived from more traditional 2-D methods that have been used to build reservoir analog data bases.The study of bed thickness distributions of various facies can help to identify important reservoir facies within the ?ll of stacked channels at the base-of-slope where massive,thick sandstone is interbedded with thinner shales.2.Geologic setting 2.1.Previous interpretations
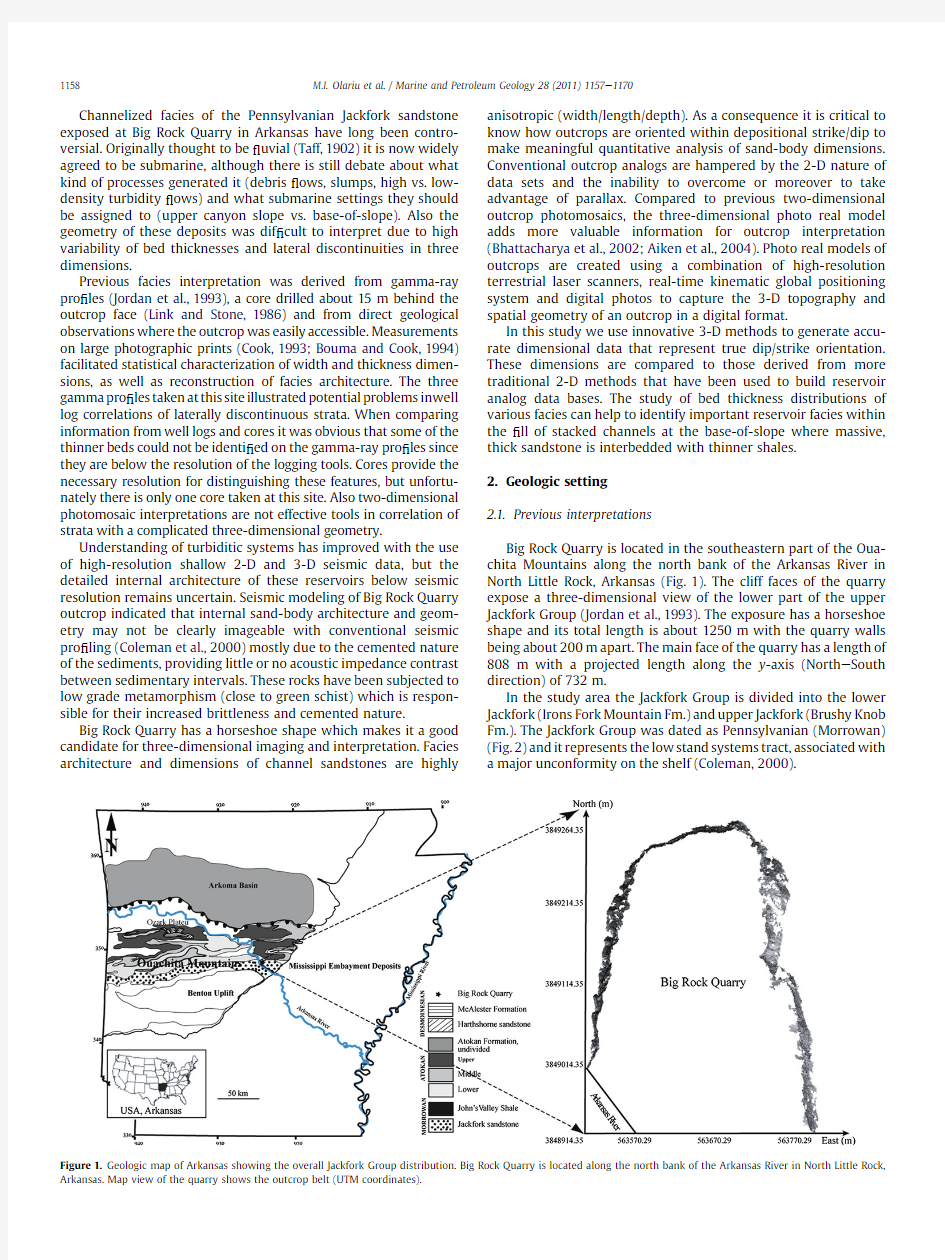
Big Rock Quarry is located in the southeastern part of the Oua-chita Mountains along the north bank of the Arkansas River in North Little Rock,Arkansas (Fig.1).The cliff faces of the quarry expose a three-dimensional view of the lower part of the upper Jackfork Group (Jordan et al.,1993).The exposure has a horseshoe shape and its total length is about 1250m with the quarry walls being about 200m apart.The main face of the quarry has a length of 808m with a projected length along the y -axis (North e South direction)of 732m.
In the study area the Jackfork Group is divided into the lower Jackfork (Irons Fork Mountain Fm.)and upper Jackfork (Brushy Knob Fm.).The Jackfork Group was dated as Pennsylvanian (Morrowan)(Fig.2)and it represents the low stand systems tract,associated with a major unconformity on the shelf (Coleman,2000
).
Figure 1.Geologic map of Arkansas showing the overall Jackfork Group distribution.Big Rock Quarry is located along the north bank of the Arkansas River in North Little Rock,Arkansas.Map view of the quarry shows the outcrop belt (UTM coordinates).
M.I.Olariu et al./Marine and Petroleum Geology 28(2011)1157e 1170
1158
The strata that crop out at this quarry were interpreted as submarine fan channel deposits (Stone and McFarland,1981),stacked channelized packages of an inner (upper)fan valley (Moiola and Shanmugam,1983),channel ?ll and levee deposits in a submarine canyon or upper part of a submarine fan channel system (Link and Stone,1986;Link and Roberts,1986)and slope canyon ?ll generated by retrogressive slope failure (Jordan et al.,1993;Slatt et al.,1997a;b ).
Based on these interpretations the channel complex at Big Rock would have been formed on the upper canyon slope.However,Bouma and Cook (1994)and Bouma et al.(1995)considered these rocks as part of a submarine channel complex likely deposited at the base-of-slope based on the limited development of levees and over ?ow deposits and on the stacked pattern of the channels.Coleman et al.(2000)estimated that this channel complex is at least 9.6km wide and 16e 24km long and it appears to pinch out about 4km north of the quarry.Most of the channels have ?ow indicators oriented west e southwest.
Shanmugam and Moiola (1997)suggested that the Jackfork sandstone was not deposited by high-density turbidity currents and is predominantly of sandy debris ?ow origin because traction-generated sedimentary structures are not present and the clay matrix content in sandstone is high (5e 10%).However this view received much critique (Slatt et al.,1997a;b;Lowe,1997;Coleman,1997;Bouma et al.,1997;D ’Agostino and Jordan,1997).The base of the slope is a zone where the gradient of the slope decreases forcing the gravity ?ows to start deposition.The major ?ll of the base-of-slope channels consists of somewhat clayey sandstone layers because the high-density currents that transported this ?ll may have not been able to move their very ?ne-grained material in suspension toward their upper part and tail and therefore some of the clay remained in the sandstone (Bouma,2000).
2.2.Architecture of the Jackfork channel complex at Big Rock Quarry
The channel complex at Big Rock Quarry consists mostly of laterally and vertically stacked channels and some remnants of channel levees.Massive sandstones comprise a signi ?cant propor-tion of the total channel ?ll and their overall thickness decreases in an easterly direction where more shale is present.This and the fact that the basal upper Jackfork sandstone is thicker at Big Rock than in exposures in the northwest and southeast suggest proximity to the axis of the sandy submarine canyon ?ll (Jordan et al.,1993)(Fig.3A).
Jackfork channel complex consists mostly of erosive-based channels that stack up in a nested pattern (Fig.3B).Because of frequent erosion part of the underlying sandstones and mud drapes are removed as well as levees adjacent to previously formed channels.The aggradational channels have well de ?ned axial regions.Mud clasts,dispersed in a clay matrix,are common in the channel axis.In places,the basal erosional surface is directly overlain by highly amalgamated sandstone beds.In the central part of the exposure,the large aggradational channels are typically ?lled with amalgamated thick to very thick,?ne-grained and massive sandstones interpreted to be deposited from high-concentration turbidity currents (Fig.4A).The channels display a massive ?ll with tabular geometry.Toward the southeastern end of the quarry the mud-clast breccias overlie the erosive surface and grade upward into thin-bedded,?ne-grained sandstones interlayered with shale which sometime are overlain by massive-to-planar strati ?ed sandstones interpreted to be deposited from high-density ?ows (Fig.4B).These channels display a layered ?ll with convergent geometry.Smaller channels dominate the upper part of the quarry;some of them display lateral accretion surfaces (Fig.4C).
Sand beds at the channel margin dip in the direction of channel migration,mostly https://www.doczj.com/doc/6510050911.html,teral accretion packages are char-acterized by interbedded high-concentration turbidites deposited by suspension (massive sandstones)and mud-clast conglomerates deposited by traction as bed load (Abreu et al.,2003).The formation of the smaller,sinuous channels at the top of the aggradational channels can be explained by a reduction in the volume of the turbidity currents that preceded the overall abandonment of this part of the turbidite system (Kneller,2003;Labourdette,2007;Labourdette and Bez,2010).Recent research (Sylvester et al.,in press )suggested that this type of architecture can be created by incision,migration and aggradation of a single channel form over time.In the upper part of the quarry there are some intervals with thin-bedded sandstone interlayered with shale (or mud-clast conglomerates)which might represent remnants of laterally equivalent levees of the channels (Link and Stone,1986;Link and Roberts,1986).The levees are absent at the base of the channel
complex.
Figure 2.Correlation chart for Mississippian and Pennsylvanian formations between deep-water Ouachita-Trough and shelfal areas to the north (from Jordan et al.,1993).
M.I.Olariu et al./Marine and Petroleum Geology 28(2011)1157e 11701159
2.3.Main facies associations
The sedimentary section at Big Rock consists of four lithofacies: (1)matrix-supported breccia,(2)massive,thick bedded,?ne-grained sandstone,(3)thin-bedded,?ne-grained sandstone inter-bedded with siltstone,and(4)?nely laminated shale(Link and Stone,1986;Cook,1993).
2.3.1.Matrix-supported breccia
This facies association consists of two main groups depending on the nature of the matrix,either shale or sand.The breccia with a sandy matrix occurs in the upper part of the outcrop.Its formation might be related to levee collapse since thin-bedded turbidites are incorporated into the sandy matrix.
The breccia with a muddy matrix is found in the basal part of the individual channel?lls just above an erosional surface cutting into the underlying channel.The mud clasts are subangular and range in size from few millimeters to centimeters(Fig.5A).The shaly-matrix breccia is interpreted to be the product of cohesive debris?ow and results mostly from the incorporation of slope to pelagic mudstones eroded during transport.2.3.2.Massive,thick-bedded,?ne-grained sandstone
Channels located in the central part of the quarry which is considered to be the axis of the canyon(Jordan et al.,1993)are typically?lled by massive,amalgamated,thick to very thick (6e16m)tabular to irregular-bedded,?ne-grained sandstones deposited from high-concentration turbidity currents(Fig.5B). Very few sedimentary structures are preserved except for dish and pillar dewatering structures which indicates a turbulent?ow;?ute cast are rare,load structures are present(Fig.6).These sandstones represent Bouma Ta divisions and are interpreted to be deposited from high-concentration turbidity currents.The sandstone bodies have?at upper surfaces and undulating lower contacts which are interpreted as channel scours.Massive Ta units are the most common and thickest Bouma divisions in the section.They are interpreted to re?ect the?ll of mixed erosive-depositional to depositional channels.
2.3.3.Thin-bedded,?ne-grained sandstone interbedded with siltstone
Toward the southeastern end of the quarry the channel?ll consists mostly of thin bedded,massive-to-planar strati?ed,?
ne-grained
Figure3.Paleogeography during deposition of the Jackfork Group and hierarchy of con?ned channels at the base-of-slope A)Paleogeographic map showing the position of the outcrop at Big Rock with respect to the paleoshelf during Pennsylvanian(simpli?ed after Jordan et al.,1993).Deltaic systems on the northern and eastern shelfs of the Ouachita basin provided sediments to the deep-water.B)Architecture of a channel complex located at the base-of-slope showing wide,shallow channels that stack up in a nested pattern. The canyon is incised into background slope muds and acts as a conduit for sediment transport into the basin.Most of the channels have erosional bases overlain by matrix-supported breccias.In the axis of the canyon the channels display massive?ll with tabular or sometime scoured geometry,whereas toward the margin of the canyon channels have a layered?ll with lenticular geometry.Toward the top of the canyon small channels with oblique geometry mark the late stages of canyon?ll that preceded the overall aban-donment of the turbidite system.
M.I.Olariu et al./Marine and Petroleum Geology28(2011)1157e1170
1160
sandstone deposited from low-density turbidity currents separated by centimeter-scale siltstone and shale (Fig.5C).They are interpreted to represent Bouma Tb,c,d divisions.Individual sandstone beds have sharp bases and display a lenticular geometry.Ripple cross-lamina-tion and climbing ripples are common in sandstone.
2.3.4.Shale (mudstone)
Finely laminated shale occurs interbedded with sandstone and is more common in the southeastern part of the quarry.Horizontal pascichnial (Helminthoidea )and agrichnial (Urohelminthoida ,Meg-agrapton ,Neonereites )trails of the Nereites ichnofacies can be seen on the bedding planes.These trace fossils indicate a deep-water setting.This facies is interpreted either as the pelagic background sedimentation or as shale drapes deposited during the waning stage of channel ?lling (Bouma Te division).3.Methodology
3.1.Three-dimensional photo real mapping
Three-dimensional photo real mapping techniques have been recently developed (Nielsen et al.,1999;Xu et al.,1999,2000;Thurmond et al.,2000;Xu,2000)as effective tools for detailed outcrop studies,but their potential has not been fully exploited.This study makes effective use of the quantitative information incorporated in three-dimensional photo real outcrops and provides new tools for quantitative mapping of sedimentary facies and https://www.doczj.com/doc/6510050911.html,ing a combination of real-time kinematic global positioning system (Leica RTK-GPS 530),a Topcon total station and laser scanners (Riegl LMS-Z360and Measurement Devices Ltd-MDL),the surface morphology of the outcrop is captured and can be expressed in a global reference system with centimeter accuracy.
The LMS-Z360scanner has an accuracy of 6mm over a distance of 200m and can capture up to 12,000data points per second with a resolution of 5mm.The MDL robotic laser range ?nding system has a typical accuracy of 10cm at 600m and an acquisition rate of about 250points per second.Coarse-scale (decimeter resolution),low density (less than 15points per 102m)capture of the outcrop using the MDL system was adequate for channel interpretation,but facies measurements were done on the high resolution outcrop model generated from LMS-Z360scanner.Cyber Mapping software (Xu,2000)allowed for real-time three-dimensional visualization and acquisition of scanner-mapped features.This software is also used to accurately drape photography onto centimeter digital terrain models generated by scanning the outcrop.
Oblique close range photography (18outcrop pictures)acquired from the ground with a Fuji S1Pro digital camera has been inte-grated with the terrain data and converted into a three-dimen-sional digital photo real model of the outcrop (Fig.7).Image registration is accomplished by converting the two-dimensional image coordinates into pixels which are positioned in three-dimensional space.Control points uniformly distributed in the image are positioned in a three-dimensional world coordinate system and can be re-projected from world space into image space.Position of control points on the outcrop face was acquired
with
Figure 4.Examples of lithologic columns for the three types of channel in ?ll exposed in the outcrop and associated depositional processes.A)Large,sandstone-rich,aggradational channels located in the axis of the canyon are typically ?lled by amalgamated,thick to very thick tabular to irregular-bedded,?ne-grained,and massive sandstones deposited from high-concentration turbidity currents.B)The channel complex margin association is composed of thin bedded,massive-to-planar strati ?ed,?ne-grained sandstone deposited from low-density turbidity currents separated by centimeter-scale parallel laminated siltstone and shale.The channels show a deep basal cut with evidence of by-pass processes with mud-clast breccia overlying the erosive surface.In places the top of the channel is ?lled with massive-to-planar strati ?ed sandstone deposited from high-density ?ows.C)Small,laterally migrating channels in the upper part of the quarry are characterized by interbedded massive sandstones deposited from high-concentration ?ows.
M.I.Olariu et al./Marine and Petroleum Geology 28(2011)1157e 11701161
a re ?ector less total station with an accuracy of 1e 4mm over a distance of 100m.
Examination of the photo real model of the outcrop allows for stratigraphic interpretation,since key stratigraphic features such as bed continuity and bed boundaries can be highlighted on the model (Fig.7).Channels bounding surfaces have been digitized on the 3-D photo real model of the outcrop built in Gocad ?,as well.3.2.Statistical analysis of channel dimensions and aspect ratios Channel width and depth parameters can easily be obtained from outcrops with suf ?cient exposure,allowing aspect ratios to be calculated.In this study we use dimensional data of individual channels to estimate channel aspect ratios (width:depth)and to evaluate the potential improvements of three-dimensional over classical two-dimensional analysis methods.
Measurements of channel width and thickness were done on the 3-D photo real model of the outcrop built in Gocad ?using a parallel view,also known as an isometric view.The main use of this type of view is to avoid parallax distortions of length,area,volume and angle that are unavoidable in most 2-D photomosaics.It is very useful for comparing the dimensions of objects that are at different distances from the viewer.
As the quarry face is oriented at different angles,generally oblique to the channel axis,channel width and thickness were projected on a vertical plane perpendicular to the mean paleo-current direction (as estimated from the outcrop)and measured accordingly.This way all widths have been corrected to widths perpendicular to paleocurrent from apparent widths measured at the outcrop.Since successive channels cut into each other removing
the upper part of previously ?lled channels,the maximum pre-served thickness of each individual channel has been considered.3.3.Quantitative facies analysis
Thicknesses of each identi ?ed lithofacies have been measured inside individual channels on the 3-D photo real model of the outcrop.Since the rock layers have various geometries (lenticular,tabular,undulating bases)and consequently they do not have a constant thickness across the channel width the maximum thickness for each bed has been considered.Facies percentages of total channel thickness and net to gross ratio for each type of channel have been estimated.4.Results
4.1.3-D correlations of channels
Paleo ?ow direction was inferred from direct measurements of longitudinal scours,ripple morphology and cross-lamination.However in most cases it was only possible to tell the direction of the ?ow and not its sense.Most measured paleocurrents suggest a southwest ?ow direction;few of them have southeast markers (Fig.8).These results are in agreement with previous studies (Jordan et al.,1993;Stone and McFarland,1981)and with the regional paleo ?ow directions in the Ouachita basin.
Since most of the paleocurrent measurements indicate that the principal direction of transport is southwest the outcrop belt displays a nearly orthogonal cut across the downcurrent direction to the north,a dip-oriented pro ?le into the basin to the
northwest
Figure 5.Facies and facies associations of the Jackfork channel complex at Big Rock Quarry.A)Matrix-supported breccia deposited by a cohesive debris ?ow (DF).This type of facies is found in the basal part of individual channel ?lls,just above the erosional surface (thick line)and below massive sandstone (MS)and is interpreted as material left behind by ?ows transiting through the channel conduits.The mud clasts are subangular and range in size from few mm to cm (see lens cap for scaling;diameter ?50mm).B)Amalgamated sandstones:Thick to very thick tabular to irregular beds,?ne-grained,structureless sandstones with water escape pillar and dish structures.The sandstones are deposited from high-density sediment gravity ?ows and represent Bouma Ta divisions.C)Thin-bedded turbidite:Thin to medium lenticular to tabular beds of ?ne-grained sandstone deposited from low-concentration turbulent ?ow interbedded with subordinate suspension shale drapes (Bouma Tb,c,d and e divisions).D)Interlaminated sandstone and siltstone:very ?ne,parallel,wavy and ripple laminated sandstone and parallel laminated siltstone deposited from dilute,low-concentration turbulent ?ows(Bouma Tb,c,and d divisions).
M.I.Olariu et al./Marine and Petroleum Geology 28(2011)1157e 1170
1162
Figure 7.Three-dimensional photo real mapping and interpretation of the deep-water succession exposed in the outcrop at the Big Rock Quarry.A)The outcrop belt displays an oblique cut across the downcurrent direction to the southeast and a nearly dip-oriented pro ?le to the north.B)3-D digital terrain model generated by the laser scanning of the outcrop.C)Surface built in Gocad from terrain data D)Oblique close-in photography acquired from the ground is integrated with terrain data and converted into a 3-D digital photorealistic model of the outcrop E)Bedding diagram superimposed on the 3-D photo real model of the outcrop F)Submarine channel architecture.Bounding surfaces are digitized in Gocad directly from the 3-D photo real model (blue ?debris ?ow;red ?thin to medium sandstone interbedded with shale;yellow ??ne-grained,structureless,amalgamated sandstones)(For interpretation of the references to colour in this ?gure legend,the reader is referred to the web version of this
article).
Figure 6.Sedimentary structures A)ripple cross-laminated sandstone N72E/S72W B)groove marks on the base of sandstone bed N54E/S54W C)cross-bedded sandstone D)climbing ripples N18E/S18W E)ripple cross-laminated shale N18E/S18W F)?ute cast on the base of sandstone N18E/S18W.
M.I.Olariu et al./Marine and Petroleum Geology 28(2011)1157e 11701163
and an oblique depositional strike section with respect to paleo?ow to the southeast(Fig.8).Bed boundaries were easily followed on the three-dimensional photo real model of the outcrop(Fig.9, Fig.10).This way strata exposed in the central part of the quarry were found to appear again on the NW quarry face.In order to correlate beds from one wall to the other attention was paid to the lateral continuity/discontinuity of the strata,to the geometry of the channels and their relative position on the outcrop.Also it has been taken in consideration the fact that the quarry dips about10 toward the northwest.The lower boundaries of the channels become steeper northward;they incline with about3 at the southeastern end and reach10 in the central part of the quarry.
One channel is exposed on both sides of the quarry and is oriented N67E/S67W(Fig.11).The part of the channel on the northeastern face reveals a strike oriented view whereas the one exposed on the northwestern face is more dip oriented.A debris?ow at the base of the channel is about3m thick and the sandstone?ll is about12m. There is a slight difference in thickness between the two parts of the channel.It is assumed that the beds become thicker downcurrent,due to non-uniformity of the?ow,reduction in con?nement at the base-of-slope,and a downstream decrease in bed shear stress(Kneller, 1995;Kneller and Branney,1995;Al Ja’Aidi et al.,2004).
4.2.Channel dimensions and aspect ratios
The mean paleocurrent orientation as determined from direct measurements at the outcrop is N34E/S34W.Therefore the orien-tation of the main outcrop belt(w N9W)is approximately at47
to
Figure8.Horseshoe shape of the outcrop at Big Rock with paleocurrent orientations.Paleo?ow direction was inferred from direct measurements of sedimentary structures identi?ed in strata exposed at the base of the outcrop.However in most cases it was only possible to tell the direction of the?ow and not its sense.Most paleocurrents suggest a southwest?ow direction;few of them have southeast markers.Since most of the channels have?ow indicators oriented west e southwest the outcrop belt displays an oblique view to the southeast and a nearly dip-oriented pro?le into the basin to the north.
M.I.Olariu et al./Marine and Petroleum Geology28(2011)1157e1170
1164
Figure 9.Three-dimensional interpretation of channelized features present on the main face of the quarry A)3-D photo real model of the outcrop made up of 12images -one picture is missing (y is north)B)Bedding diagram superimposed on the 3-D virtual outcrop (red e channel boundaries)C)Bedding diagram showing the stacked channel pattern.D)Facies architecture of channel complex.Different types of channels are highlighted as follow:yellow e large,aggradational channels with well de ?ned axial regions composed of high relief basal erosional surfaces overlain by matrix-supported breccia which grades upward into amalgamated sandstones;orange e small,laterally migrating channels;red e aggradational channels made out of thin-bedded sandstones interbedded with shale which overlain the basal breccias and skin color e remnants of laterally equivalent levees of channels (For interpretation of the references to colour in this ?gure legend,the reader is referred to the web version of this
article).
Figure 10.Three-dimensional interpretation of channelized features present on the central and northwest face of the quarry close to the river A)3-D photo real model of the outcrop made up of 6images -one picture is missing (y is north)B)Bedding diagram superimposed on the 3-D virtual outcrop (red e channel boundaries,yellow e channel ?ll)C)Bedding diagram showing the stacked channel pattern.D)Facies architecture of channel https://www.doczj.com/doc/6510050911.html,rge,aggradational channels are highlighted in yellow e they have well de ?ned axial regions composed of high relief basal erosional surfaces overlain by matrix-supported breccia which grades upward into amalgamated sandstones (For interpretation of the references to colour in this ?gure legend,the reader is referred to the web version of this article).
M.I.Olariu et al./Marine and Petroleum Geology 28(2011)1157e 11701165
the transport direction of the turbidite which means that the estimated widths from the main face of the quarry on the 3-D photo real model are overestimated compared to the widths derived from the projected,transverse cross-section.The digitized channel boundaries from the photo real model were projected on a plane oriented N56W/S56E to correspond to the estimated cross-section of the channels and the width measured accordingly.This way all widths have been corrected to widths perpendicular to paleo-current from apparent widths measured at the outcrop.The other face of the outcrop close to the river is oriented N18E/S18W,almost parallel to the mean paleo ?ow.
Signi ?cant channel width/thickness variation can be recognized at outcrop scale (Fig.12).Minimum channel thickness observed at the outcrop is 2.1m and the maximum is 23.7m with a mean of 8.3m.The larger,sandstone-rich,aggradational channels at the base of the quarry have widths of about 145m and thickness of about 10m.They can reach widths of 300m,but when corrected they have a maximum width of about 200m (33%less).Laterally migrating channels within the upper part of the quarry are smaller with thicknesses between 2m and 6.3m (mean w 4.3m)and widths of at least 25m with an average of 59m.When corrected with respect to the mean paleocurrent direction they are at least 16m in width and reach a maximum of 75m with an average width of 40m.
Estimated cross-channel width of the channel-shaped unit (perpendicular to the main paleocurrent direction,N34E)and maximum measured thickness of individual channels were plotted on a log e log graph (Fig.13)and the aspect ratios calculated for each
channel.Channel width commonly is one order of magnitude higher than channel depth.Channel bodies have rather ?at channel ?lls (width/thickness ratio 3:1to 32:1)with a mean aspect ratio of 15:1.
Aggradational channels have a minimum apparent ratio of 4:1,a maximum of 32:1and a mean value of 16:1.Sinuous channels have a minimum apparent ratio of 9:1,a maximum of 17:1and a mean value of 14:1.When measured across the estimated cross-channel section all the ratios have lower values compared to those measured from the outcrop.Aggradational channels have a minimum width to thickness ratio of 3:1,a maximum of 20:1and an average value of 11:1.Sinuous channels have a minimum ratio of 7:1,a maximum of 12:1and a mean value of 9:1(Table 1).
4.3.Quantitative facies analysis
Facies thickness and percentages of total channel thickness,as well as net to gross ratios have been estimated for each channel.The sandstone comprises a signi ?cant proportion (in average 83.28%)of the total channel thicknesses (Fig.14),while shale and debris ?ow deposits make about 17.24%with a range from 3.66%to 59.2%(minimum net/gross ?40.8).
If only the large,aggradational channels that make up the lower two thirds of the quarry are considered the sandstone will make up at least 41%of the total channel thickness with an average of 83%.Shale and debris ?ow deposits represent about 18%of the channel
thickness.
Figure 11.Three-dimensional interpretation of channelized features at Big Rock A)Three-dimensional photo real model of the central part of the outcrop -oblique view of the quarry looking northeast.The horseshoe shape of the quarry allowed for correlation between facing walls.Interpreted channel is shown in yellow while its projections on the planes parallel (N27E)/perpendicular (N117E)to the median paleocurrent orientation are purple and magenta.B)Channel bounding surfaces are highlighted on the 3-D photo real model of the outcrop making possible correlation of strata exposed on the distinct sides of the quarry.C)Geometry pattern of a nested channel complex at the base-of-slope.Surfaces corresponding to individual channels are built in Gocad ?from the scanned (x,y,z)data points.D)A surface is built to connect the parts of the channel that crop out on the two sides of the quarry.The channel is oriented NNE-SSW (y is north and x is east)(For interpretation of the references to colour in this ?gure legend,the reader is referred to the web version of this article).
M.I.Olariu et al./Marine and Petroleum Geology 28(2011)1157e 1170
1166
The smaller channels at the top of the quarry are comprised of about 85%sandstone (range from 68%to94%).The lateral accretion packages have not been considered,only thickness in the axis of the channel has been measured.Shale and debris ?ow make up about 16%of the total channel thickness with a range from 6%to 32%.
When occurring in amalgamated units the sandstones have a mean thickness of about 60cm covering a range from 13cm to 5m (Fig.15A).The thickness of the amalgamated units reaches in average 4m with a maximum thickness of 16m.Thin-bedded sandstone layers have an average of 34cm being at least 9cm thick up to 2m (Fig.15B).Shale intraclast breccia has an average
thickness of about 1m (Fig.15C).Sub-meter thickness usually occurs in the lateral accretion packages of the sinuous channels or in some of the preserved levees while thicker beds occur at the base of aggradational channels.Thin layers of shale have an average thickness of 8cm covering a range from 2cm to 30cm (Fig.15D).5.Discussions
5.1.Uncertainty of 2-D vs.3-D measurements
Signi ?cant variations exist among channel dimensions (width and thickness)and aspect ratios in turbidite systems as they are measured from modern and ancient records especially because of the difference in scale.Our data (channel width and thickness)when compared to data published by Clark and Pickering (1996)falls in the lower aspect ratio area of the data scatter (Fig.13).Their data comes from modern,ancient and subsurface data sets with channels,canyons and channel-shaped elements of deep-water depositional systems plotted together which explains the wide range covered by the data.
Jackfork stacked channel sequences deposited at the base-of-slope have low aspect ratios (4:1to 32:1).When compared with outcrop data from similar deep-water settings such as the outcrop example,from Fan#3Tanqua Karoo basin,in South Africa (Bouma et al.,1995),Mt.Messenger Formation,in New Zealand (Browne and Slatt,2002),Zerrissene Formation,in Namibia and Marnoso Arenaceea Formation,in Italy (Cossey,1994)our results show similar values for the width/thickness ratio.The channel complex at Tanqua Karoo is characterized by high sandstone/shale ratio and rather ?at channel ?lls (aspect ratios from 30:1to 50:1).Mt.Messenger channels have aspect ratios that average 23:1(range from 13:1to 47:1).The Zerrisene turbidite of Namibia and Marnoso Arenacea of Italy have width to thickness ratios of 19:1and between 10:1and 30:1respectively.Jackfork channels at Big Rock Quarry have somewhat smaller aspect ratios which might be explained by the different methods used to measure the channel dimensions (3-D vs.2-D measurements).Outcrop data from Magallanes Basin,Chile indicates a mean width for slope channels of 307m and mean thickness of 13m (McHargue et al.,2010
).
Figure 12.Histogram frequency of channel dimensions.Channel widths and depths are measured on the 3-D photo real model.A)Histogram frequency of apparent channel width as measured at the outcrop.B)Histogram frequency of channel widths as measured in a plane perpendicular to the mean paleocurrent orientation (N34E).C)Histogram frequency of maximum preserved channel thickness (difference in height measured between upper and lower channel boundaries).All histograms display a bimodal distribution showing larger,aggradational channels to the left and smaller,lateral migrating channels to the
right.
Figure 13.Channel aspect ratios (width vs.thickness).Estimated cross-channel width of the channels (apparent,as measured from the 3-D outcrop and corrected width,perpendicular to the main palecurrent direction,N34E)and maximum measured thickness of individual channels were plotted on a log e log graph and the aspect ratio calculated for each channel.Channel width commonly is one order of magnitude higher than channel depth.Channel bodies have ?at channel ?lls (width/thickness ratio 3:1to 32:1)with a mean aspect ratio of 15:1.Circles and crosses are channel dimensions from modern and ancient turbidite systems as published by Clark and Pickering (1996).
Table 1
Channel dimensions and aspects ratios.Channel type
Width (m)Apparent width (m)Thickness (m)Ratio (w:t)Apparent ratio Laterally migrating channels 16.27e 75.1525.33e 102.742e 6.37:1e 12:1
9:1e 17:1
40.39
58.63
4.3
9:114:1Aggradational channels
28.71e 198.3536.87e 313.62 3.32e 23.73:1e 20:1
4:1e 32:1
102.07
144.86
9.71
11:1
16:1
M.I.Olariu et al./Marine and Petroleum Geology 28(2011)1157e 11701167
Bouma and Cook,1994estimated from 2-D photomosaics a total length of the main face of the quarry projected along North e South direction of 838.2m (2750feet)which is overestimated by 100m (13.5%).
Since the maximum channel width measured on the digital outcrop is 314m (mean width 122m)the layers that make up the
channel in ?ll should have at a maximum this length.Therefore at least some of the layers measured by Bouma and Cook (1994)are overestimated since their maximum measured length for sand is 448m,347m for thin beds and 381m for muds,which is well over 300m.Based on these values 2-D outcrop data overestimated the extent of sand layers by 43%,thin beds by 10.5%,and mud by 21%.It is mentioned in their paper that the actual layer length is not the distance between both ends of one layer,but the distance along the y -axis of the projected length.Since the projected length is shorter than the actual length of the outcrop the length of the layers in outcrop would have been even bigger.Also their layer thicknesses have higher mean values when compared with ours.Their amal-gamated sandstones have mean thickness values of about 1.77m while ours have in average 64cm;their thin beds have mean values of 4.3m,ours only 34cm;they found that debris ?ow deposits are about 1.52m thick while we found mean values of 72cm;and ?nally their shale is 1.27m thick while the shale we measured is about 8cm thick.We assume that this depends on the resolution and various scales and different angles of view of the pictures used in the photomosaic.For each of the four identi ?ed lithologies they have at least 4times more layers.This may happen because they measure vertical sections equally spaced (about 30m)along the outcrop which means that some of the layers are considered twice or more in the
calculations.
Figure 14.Facies percentages of total channel thickness.The four identi ?ed lithofacies are color coded and plotted as percentages of total channel thickness.The small laterally migrating channels located at the top of the quarry are circled,(for position of channels on the quarry walls look at Figures.9and 10).Sandstone comprises a high proportion (more than 80%)of the channel ?
ll.
Figure 15.Histogram frequency and statistics of bed dimensions.Facies thickness measurements have been obtained from channels identi ?ed on the 3-D photo real model.A)amalgamated sandstone.B)thin beds.C)debris ?ow deposits.D)shale layers.
M.I.Olariu et al./Marine and Petroleum Geology 28(2011)1157e 1170
1168
6.Conclusions
The primary purpose of studying this outcrop was to determine its viability as an analog input for deep-water hydrocarbon reser-voir models.The geometry and facies pattern of nested channel complex at the base-of-slope may provide models of heterogeneity distribution.This paper described the geometry and the internal architecture of the channels within the channel complex of the Jackfork Group.
This study represents the?rst attempt of three-dimensional interpretation of the deposits exposed at Big Rock based on correlation of channels from both sides of the quarry,a dif?cult exercise without a three-dimensional data set.Despite limited exposure relative to channel dimensions,the photo real model provides quantitative and spatial data suitable for three-dimen-sional facies architecture studies.
Reconstruction of body geometry was accurate in areas where lithologies were highly distinct and where surfaces/bodies could be correlated on the two sides of the quarry.Channel bounding surfaces were mapped on the three-dimensional photo real model, as well as the internal architecture of the channel?ll.Channel dimensions and morphology,stacking pattern,limited develop-ment of levees and overbank wedges and a high sandstone/shale ratio(5:1)suggest deposition at the base-of-slope.
Our analysis shows that the widths of the channels as they are measured in outcrop are overestimated by30%compared to the widths measured perpendicular to the paleo?ow direction.Most of the channels have low aspect ratio(width:thickness?15:1)and high net to gross(more than80%).Facies percentages of total channel thickness shows that the sandstone comprises a signi?cant proportion(about83%)of the channel?ll,whereas shale and matrix-supported breccia make up only8%,and17%respectively.
Since some of the beds measured on2-D photo panels are wider than the actual channels as they are measured on the3-D photo real model of the outcrop we suggest that the2-D data set overestimates the channel width by at least10%.High resolution3-D outcrop data sets help in reducing uncertainty in the geologic interpretation of sparse and lower resolution well log and subsurface data. Acknowledgements
This study bene?ted from a GCSSEPM Ed Picou Fellowship Grant for Graduate Studies in the Earth Sciences.The authors would like to thank Charlie Stone for lively discussions and input. References
Abreu,V.,Sullivan,M.,Pirmez,C.,Mohrig,D.,https://www.doczj.com/doc/6510050911.html,teral accretion packages (LAPs):an important reservoir element in deep water sinuous channels.Marine and Petroleum Geology20,631e648.
Aiken, C.L.V.,Xu,X.,Thurmond,J.,Abdelsalam,M.,Olariu,M.I.,Olariu, C., Thurmond,A.,2004.3-D Laser scanning and virtual photorealistic outcrops: acquisition,visualization and analysis.AAPG Short Course.
Al Ja’Aidi,O.S.,McCaffrey,W.D.,Kneller,B.C.,2004.Special Publications.Factors In?uencing the Deposit Geometry of Experimental Turbidity Currents:Impli-cations for Sand-body Architecture in Con?ned Basins,vol.222.Geological Society,London,pp.45e58.
Bhattacharya,J.P.,Aiken,C.L.V.,Corbeanu,R.M.,McMechan,G.A.,Xu,X.,Zeng,X., White, C.D.,2002.3-D Outcrop Reservoir Characterization.AAPG Annual Meeting,Houston.
Bouma, A.H.,Cook,T.W.,1994.Architecture of a Submarine Channel Complex, Jackfork Formation,Arkansas,vol.4.Louisiana Basin Research Institute Bulletin, pp.11e22.
Bouma,A.H.,Lee,G.H.,van Antwerpen,O.,Cook,T.W.,1995.Channel Complex Architecture of Fine-grained Submarine Fans at the Base-of-slope:Transactions, vol.45.Gulf Coast Association of Geological Societies,pp.65e70.
Bouma, A.H.,DeVries,M.B.,Stone, C.G.,1997.Reinterpretation of depositional processes in a classic?ysch sequence(Pennsylvanian Jackfork group),Ouachita Mountains,Arkansas and Oklahoma:discussion.AAPG Bulletin81,470e472.Bouma,A.H.,2000.Fine-grained,mud-rich turbidite systems:model and compar-ison with coarse-grained,sand-rich systems.In A.H.Bouma and C.G.Stone.
(Eds.),Fine-grained turbidite systems,AAPG Memoir72/SEPM Special Publi-cation68,pp.9e20.
Browne,G.H.,Slatt,R.M.,2002.Outcrop and behind-outcrop characterization of
a late Miocene slope fan system,Mt.Messenger formation,New Zealand.AAPG
Bulletin86,841e862.
Clark,J.D.,Pickering,K.T.,1996.Submarine Channels:Processes and Architecture.
Vallis Press,London,p.231.
Cossey,S.P.J.,1994.Reservoir modeling of deepwater clastic sequences:mesoscale architectural elements,aspect ratios and producibility.In P.Weimer, A.H.
Bouma,and B.F.Perkins.(Eds.),Submarine fans and turbidite systems:Gulf Coast Association SEPM15th Annual Research Conference,83e93.
Coleman Jr.,J.L.,2000,Carboniferous Submarine Basin development of the Ouachita Mountains of Arkansas and Oklahoma.In A.H.Bouma and C.G.Stone.(Eds.)Fine-grained turbidite systems,AAPG Memoir72/SEPM Special publication68,pp.21e32. Coleman Jr.,J.L.,Sheppard,F.C.,Jones,T.K.,2000.Seismic Resolution of Submarine Channel Architecture as Indicated by Outcrop Analogs.In A.H.Bouma and C.G.
Stone.(Eds.)Fine-grained turbidite systems,AAPG Memoir72/SEPM Special Publication68,pp.119e126.
Coleman Jr.,J.L.,1997.Reinterpretation of depositional processes in a classic?ysch sequence(Pennsylvanian Jackfork group),Ouachita Mountains,Arkansas and Oklahoma:discussion.AAPG Bulletin81,466e469.
Cook,T.W.,1993.Facies architecture of deep-water channel deposits,Brushy Canyon Formation,West Texas,and Jackfork Group,Arkansas:Unpublished Master’s Thesis,Louisiana State University,108p.
D’Agostino,A.E.,Jordan,D.V.,1997.Reinterpretation of depositional processes in
a classic?ysch sequence(Pennsylvanian Jackfork group),Ouachita Mountains,
Arkansas and Oklahoma:discussion.AAPG Bulletin81,473e475.
Jordan,D.W.,Lowe,D.R.,Slatt,R.M.,D’Agostino,A.,Scheihing,M.H.,Gillespie,R.H., Stone,C.G.,1993.Scales of Geological Heterogeneity of Pennsylvanian Jackfork Group,Ouachita Mountains,Arkansas:Applications to Field Development and Exploration for Deep-water Sandstones.Field Trip Guidebook no.3.Guidebook Dallas Geological Society,p.142.
Kneller, B.,1995.Special Publications.Beyond the turbidite paradigm:physical models for deposition of turbidites and their implications for reservoir prediction,vol.94.Geological Society,London.31e49.
Kneller,B.,2003.The in?uence of?ow parametrers on turbidite slope channel architecture.Marine and Petroleum Geology20,901e910.
Kneller,B.C.,Branney,M.J.,1995.Sustained high-density turbidity currents and the deposition of thick massive sands.Sedimentology42,607e616. Labourdette,R.,2007.Integrated three-dimensional modeling approach to stacked turbidite channels.AAPG Bulletin91,1603e1618.
Labourdette,R.,Bez,M.,2010.Element migration in turbidite systems:Random or systematic depositional processes?AAPG Bulletin94,345e368.
Link,M.H.,Roberts,M.T.,1986.Pennsylvanian paleogeography for the Ozarks, Arkoma,and Ouachita basins in east-central Arkansas.pt.2.In:Stone,C.G., Haley,B.R.(Eds.),Sedimentary and Igneous Rocks of the Ouachita Mountains of Arkansas.Arkansas Geological Commission,Guidebook,pp.37e40.
Link,M.H.,Stone,C.G.,1986.Jackfork sandstone at the abandoned big rock quarry, north little rock,Arkansas.In:Stone,C.G.,Haley,B.R.(Eds.),Sedimentary and Igneous Rocks of the Ouachita Mountains of Arkansas.Guidebook GSA Annual Meeting,San Antonio,pp.1e8.
Lowe, D.R.,1997.Reinterpretation of depositional processes in a classic?ysch sequence(Pennsylvanian Jackfork group),Ouachita Mountains,Arkansas and Oklahoma:discussion.AAPG Bulletin81,460e465.
McHargue,T.,Pyrcz,M.J.,Sullivan,M.D.,Clarck,J.,Fildani,A.,Romans,B.,Covault,J., Levy,M.,Posamentier,H.,Drinkwater,N.,2010.Architecture of turbidite channel systems on the continental slope:Patterns and predictions.Marine and Petroleum Geology,1e43.
Moiola,R.J.,Shanmugam,G.,1983.Submarine fan sedimentation,Ouachita Moun-tains,Arkansas and Oklahoma.AAPG Bulletin67(3),517.
Nielsen,K.C.,Aiken,C.L.V.,Xu,X.,1999.Digital Mapping Methods:Accurate Digital Data Capture and Analysis for the Field Geologist.GSA Continuing Education Manual,p.119.
Shanmugam,G.,Moiola,R.J.,1997.Reinterpretation of depositional processes in
a classic?ysch sequence(Pennsylvanian Jackfork group),Ouachita Mountains,
Arkansas and Oklahom.AAPG Bulletin79,672e695.
Slatt,R.M.,Al-Siyabi,H.A.,Williams, E.T.,Stone, C.G.,Weimer,P.,Davis,R.J., Jordan,D.W.,1997a.Oil and Gas Journal95(33),67e72.
Slatt,R.M.,Weimer,P.,Stone,C.G.,1997b.Reinterpretation of depositional processes in a classic?ysch sequence(Pennsylvanian Jackfork group),Ouachita Moun-tains,Arkansas and Oklahoma:discussion.AAPG Bulletin81,449e459. Slatt,R.M.,2000.Why outcrop characterization of turbidite systems.In A.H.Bouma and C.G.Stone.(Eds.),Fine-grained turbidite systems,AAPG Memoir72/SEPM Special Publication68,pp.181e186.
Slatt,R.M.,Stone,C.G.,Weimer,P.,2000.Characterization of slope and basin facies tracts,Jackfork group,Arkansas,with applications to deepwater(Turbidite) reservoir management.20th Annual B.F.Perkins Resarch Conference.In: Weimer,P.,Slatt,R.M.,Coleman Jr.,J.L.,Bouma,A.H.(Eds.),Deep-water Reser-voirs of the World.Gulf Coast Secion SEPM Foundation,pp.940e980. Stone,C.G.,McFarland III,J.D.,1981.Stop1e Abandoned Big rock quarry in upper part of Jackfork sandstone.81-1.In:Stone,C.G.,McFarlandIII,J.D.(Eds.),Field Guide to the Paleozoic Rocks of the Ouachita Mountain and Arkansas Valley Provinces,Arkansas.Arkansas Geological Commission Guidebook,pp.7e13.
M.I.Olariu et al./Marine and Petroleum Geology28(2011)1157e11701169
Sylvester,Z.,Pirmez,C.,Cantelli A.,2010.A model of submarine channel-levee evolution based on channel trajectories:Implications for stratigraphic archi-tecture,Marine and Petroleum Geology,in press.
Taff,J.A.,1902.Description of the Atoka quadrangle.U.S.Geological Survey Geologic Atlas.Folio79.
Thurmond,J.B.,L?seth,T.M.,Riven?s,J.C.,Martinsen,O.J.,Aiken,CL.V.,Xu,X.,https://www.doczj.com/doc/6510050911.html,ing Outcrop Data in the21st Century e New Methods and Applications,with Example from the Ainsa Turbidite System,Ainsa,Spain.AAPG Annual Meeting Program.Xu,X.,Aiken,C.L.V.,Nielsen,K.C.,1999.Real time and the virtual outcrop improve geological?eld mapping,EOS,transactions.American Geophysical Union80(29), 322e324.
Xu,X.,2000,Three-dimensional Virtual Geology:Photorealistic outcrops,and their acquisition,visualization and analysis,Ph.D.dissertation,UTD.
Xu,X.,Aiken, C.L.V.,Bhattacharya,J.P.,Corbeanu,R.M.,Nielsen,K.C., McMechan,G.E.,Abdelsalam,M.G.,2000.Creating virtual3-D outcrop.The Leading Edge19(2),197e202.
M.I.Olariu et al./Marine and Petroleum Geology28(2011)1157e1170 1170