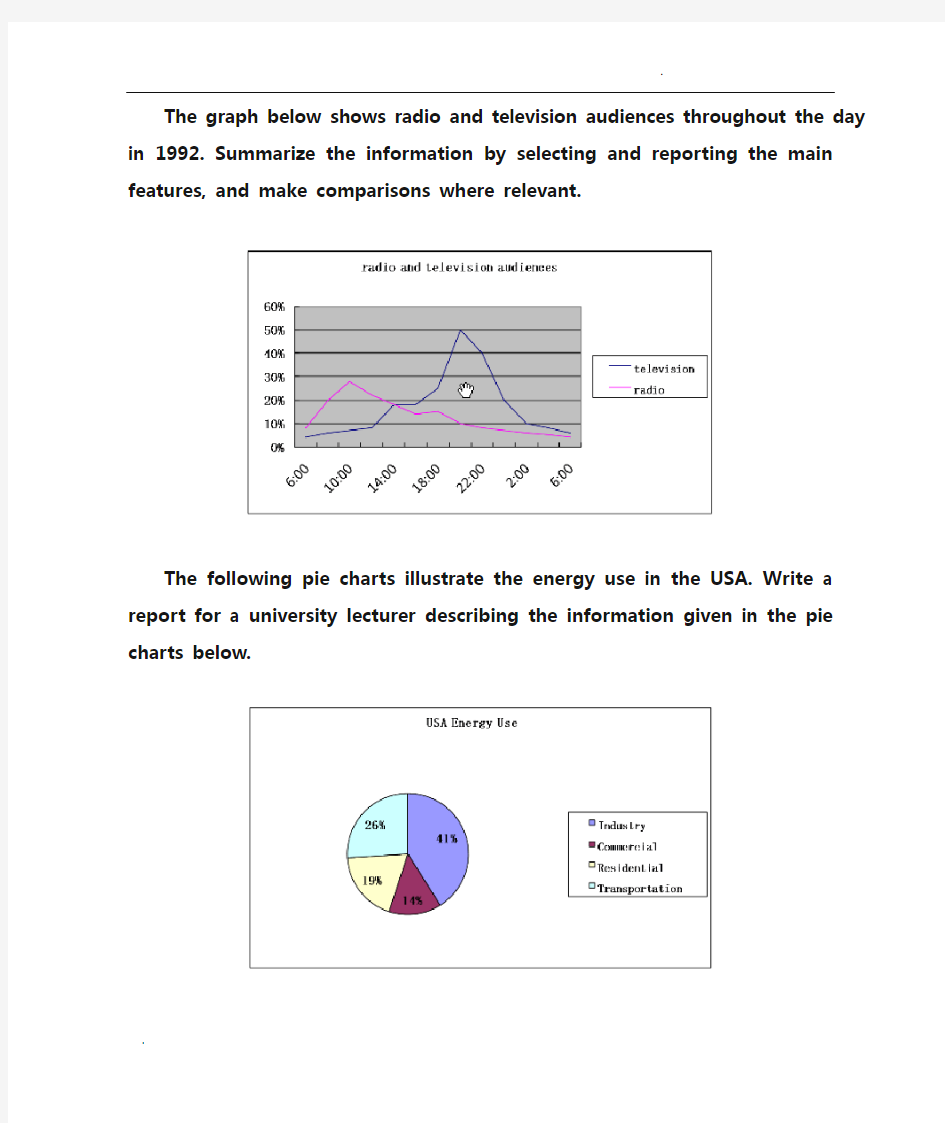

The graph below shows radio and television audiences throughout the day in 1992. Summarize the information by selecting and reporting the main features, and make comparisons where relevant.
The following pie charts illustrate the energy use in the USA. Write a report for a university lecturer describing the information given in the pie charts below.
The following two pies show the average family income of New Zealand in 1990 and 2000 and the way people spend their income. Write a report for a university lecturer describing the information given in the pie charts below.
The graph below show the number of hours Canadians spent on watching TV from 1990 to 2001, and the number by age in 2001. Summarize the information by selecting and reporting the main features, and make comparisons where relevant.
The graphs below show the marriage and divorce number in the US and the marital status of its population in 1970 and 2000. Summarize the information by selecting and reporting the main features, and make comparisons where relevant.
The graph below shows the participation of Australian children in sports outside school hours in 2003. Summarize the information by selecting and reporting the main features, and make comparisons where relevant.
The chart below shows the different levels of post-school qualifications in Australia and the proportion of men and women who held them in 1999. Summarize the information by selecting and reporting the main features and make comparisons where relevant.
The bar chart below shows the three main coursed of land damage (in million hectares) in four different areas in the world. Summarize the information by selecting and reporting the main features, and make comparisons where relevant.
The chart below shows the information of the expenditure (in million) of transportation and communications in Britain in 1970, 1990 and 2010. Summarize the information by selecting and reporting the main features, and make comparisons where relevant.
The table below shows the monthly expenditure of an average Australian family in 1991 and 2001. Summarize the information by selecting and reporting the main features, and make comparisons where relevant.
The table below shows some data regarding Australia’s nursing employment and total workforce in 1987 and 2001. Summarize the information by selecting and reporting the main features, and make comparisons where relevant.
The table below shows the percentage of households with various electronic items in New Zealand in 1995 and 2002. Summarize the information by selecting and reporting the main features, and make comparisons where relevant.
The table below shows the average hour worked by full-time and part-time workers according to gender in three countries. Summarize the information by selecting and reporting the main features, and make comparisons where relevant.
The table gives information about the female workforce and female managers in five countries. Summarize the information by selecting and reporting the main features, and make comparisons where relevant.
The table shows the response to the questionnaire given by two groups of people (club members and the general public) who showed their opinions about a new theatre. Summarize the information by selecting and reporting the main features, and make comparisons where relevant.
The table below shows the use of three energy source’s in the UK, their world reserve and how many years they are expected to last. Summarize the information by selecting and reporting the main features, and make comparisons where relevant.
The table shows the four social and economic indicators in four countries in 2000. Summarize the information by selecting and reporting the main features, and make comparisons where relevant.
The charts show the number of Japanese tourists traveling abroad between 1985 and 1995 and Australia’s share of the Japanese tourist market. Write a report for a university lecture describing the information shown below.
●批改By Will 本次批改严格按照ILETS小作文评分标准进行。ILETS小作文评分项:TA (内容的完整性), CC (连贯性及一致性), GRA (语法范围及精准度), LR (词汇资源)。文末会进行总评及打分。 ●文中标识: 用词不当逻辑错误语法错误修改添加 The graph provides the information concerning the average temperatures on a month basis in three major cities.(介于有两张图,都要提一下。此后可加一句:In addition, clearly demonstrated in the table are the time of sunshine on an annual base.) (补充:在下一段看到了你对于后一张图的总结,这样的话建议你在开头强调一下“the first graph”) As can be seen from the graph, there is a similar trend in terms of average monthly temperature between London and New York during the period from January to December. (可加入连接词:To be specific) The average temperature in London (介于你后面写的是两个城市的数据,这里改为:for both of the cities) gradually rises from January to July both in London and new york, reaching a peak at 25 degrees and 20 degrees respectively. After that, the following 4 months witness a dramatic decrease both in London and new york. In comparison (这里不妨分段), an opposite trend is found in Sydney. It (这是悉尼的第一句,建议写出来具体的量词至少:The temperature) keeps stable at 25 degrees from January to march, after which the average temperature undergoes a considerable descent, reaching the bottom point at approximately 15 degrees, before there is (there is 没必要了,可以去除) a steady ascent by 10 degrees. It is obvious that the table depicts the average number of hours of sunshine per year in three major cities. As we can see from the statistics, when it comes to the total annual hours of sunshine, new york ranks first, followed by Sydney ,London lies last. Specifically, people who live in new york enjoy 2,353 hours of sunshine every year, which is similar to people living in London with 2,473 hours (不是人和人像,是时间长短像,改为:which is similar to the amount of sunshine for those in London). However, only 1,180 hours of sunshine are found in London annually. 总评6.5(TA6.5 CC6.5 LR6.5 GRA7.0) 1.语法变化上从句数量可以了,分词的使用还可以多一些。偶尔试试一到两句倒装,如我在开头给你的那个。 2.趋势等词汇变化可以,试着多换换题目话题词汇,如people=residents=citizens
雅思写作满分范文:雅思图表作文怎样才能拿满分 The table below gives information on consumer spending on different items in five different countries in 2002. Percentage of national consumer expenditure by category - 2002 构思过程: I know that I can write a short introduction by paraphrasing the question. I look for an overall trend. I can see that the food/drinks/tobacco category has the highest percentages, and leisure/education has the lowest. Now I want to write two main body paragraphs. I need to select something to say about each country. Remember, there is no rule about what information you select; everyone will do this differently. I look for the highest figures in each category: I can see that Turkey has the highest figure for food/drinks/tobacco AND for education/leisure. Italy has the highest figure for clothing/footwear. So, I'll write a paragraph about Turkey and Italy. My final paragraph needs to talk about Ireland, Spain and Sweden. Maybe I'll point out that Ireland has a high figure for the first category, Spain has the lowest figure for education/leisure, and Sweden has the lowest figures for the first AND second categories.
雅思小作文题型多样,其中就包括地图题,本文将详细讲解雅思小作文地图题写作技巧。评分标准 ?TA – Task Achievement 任务完成情况 ?CC – Coherence and Cohesion 意合与形合 ?LR – Lexical Resource 词汇资源 ?GRA – Grammatical Range and Accuracy 语法广度与精确度 审题 The map below shows the development of the village of Ryemouth between 1995 and present. 文章结构 第一段 交待写作目的 第二段 描述1995年的地图 第三段
拿现在的地图和95年的做对比 第四段 总结全文 第一段 This report compares how the village of Ryemouth has developed and changed since the year of 1995. 题目:The map below shows the development of the village of Ryemouth between 1995 and present. 第二段 As is clearly described in the first picture, Ryemouth was a coastal city which was divided into three parts by two roads. In the southern part, there was a fishing port on the sea, with a fish market located in the north and a coffee shop in the north-east. A block of shops was situated on the opposite side of the market… 第三段 In the second picture, the village changed a lot. The fishing port has been removed and the fish market is replaced by apartments. Several restaurants also occupy the place of the shops on the roadside. Moreover, a parking lot is newly built on the east of the hotel. In addition, … 第四段 Overall, based on the brief description above, it is clear that the general layout of the village does not change a lot, while some newly-built facilities and housing has ornamented the small village.
101. You should spend about 20 minutes on this task. The line graph below gives information about the number of visitors to three London museums between June and September 2013. Summarise the information by selecting and reporting the main features, and make comparisons where relevant. Write at least 150 words. Test Tip Check the horizontal axis to find whether the graph refers to past, present, future or all three. We use the present simple to describe the graph: The graph shows… , We can see… If the graph refers to past period of time, we use the past simple, and if the graph includes future times, we use will or it is predicted that. Look at the line graph and complete the text with the correct forms of the verbs in brackets and the correct prepositions.
雅思考试小作文评分标准
雅思写作考试Task 1根据以下四个方面来评定: 1.Task achievement对于任务的完成情况 指的是考生怎样描述所给数据,是否能够辨别及描述与图表有关的主要信息。要求考生回答问题准确,即考生的作文内容是否与所给数据信息密切相关。考生如果想在这部分取得高分,行文就必须尽可能包括主要的相关信息,不要加入无关信息。因此,第一步的审图工作非常关键,考生一定要辨别出图表数据所表达的主要趋势和主要信息。当考生辨认出主要的信息后,就需要进一步寻找相关的细节来佐证主要信息。 完成图表作文要做很多准备工作,其中最主要的是列提纲。众所周知,图表提供大量信息,但是考生不必把所有的信息都描述出来,只要找到主要的信息并在心里组织或写出简要的提纲就可以。考生可以在草纸上列出提纲,也可以随意涂写提纲,即使是汉语也没有关系。在雅思考试中,由于时间比较宝贵,所以提纲一定要简洁,考生可以适当使用自己能识别的缩写形式和其它符号来拟写。提纲拟定后,考生落笔时只要在每一段主要的信息之后补充相应的细节来佐证,便可完成整篇文章的行文。
一旦考生收集到足够的信息,就已经满足了雅思考官的第一条评分标准。 2.统一性和连贯性(Coherence and cohesion) 统一性和连贯性指的是考生怎样组织报告, 报告是否易于理解,同时考查句子之间关系连词的使用。一篇组织得当、易于阅读的作文将会给雅思考官一个良好的印象。考生需要注意: ●段落的组织:考生报告的结构一定要组织得当, 各段落要 连贯,以正确的顺序排列; ●句群的组织:句子之间最好用连词来组织句群; ●句子的变化:尽量避免使用只有一个主语和谓语动词的单 句,把单句扩展成更长的复合句。 (1)段落的组织 在雅思考试Task 1中,一般来说,每个段落只应讨论一个主要变化趋势。考生可根据这一主要趋势添加与其相关的佐证细节,完成该段的主要信息与相关信息的描述。 总的规则是,每一个不同的主要趋势都要各用单独的一段来描述,表中有几个主要趋势,正文就应分为几段。每一段要包含不止一个句子,除了表示主要趋势的主题句之外,还应辅之以与该主要趋势一致的相关细节描述,如具体的数字、数值、升降变化及倍数表达等。如果这个信息只能用一句话表达,那么或者把这个信息放在上一段最后一句,或者
一个地图题的开头: The map about the development of the village sufficiently illustrates the way of progress of this area. In this map, we can find four main sectors and two main roads intersected with one railway and one motor way. It seems the overall development of this village has strong connection with the construction of roads. 雅思小作文地图题词汇 Part 1:表时间 流程图和地图题中都可能涉及时间表达。流程题中,使用较多的是过程时长的表述,而地图题的时间使用则体现为地理变迁的时间变化。一般在方位选址图题中较少出现。确切的时间指引,既增加文章的自然和连贯度,也能体现行文的精确性。 常见表示时间的词: in few hours几小时 during the period of …在…期间after 10 days 10天后 from…to从…到… between …and在…之间 over the…year period在一个…年期间5 years before 5年前a decade earlier几十年前from that moment on从那时起after a while一会 since自从 since then自从 finally最后 over the subsequent …years近连续几年 例句:The process lasts for up to 7 day s and the products are finally distributed to customers. Part 2:表空间 空间表达地图题出现概率较高,但流程图也偶尔出现。空间应该是地图题解题关键和主要特点。许多考生容易误把地图题的空间位置写成上下左右位置,这是失分点非常大的地方。朗阁海外考试研究中心的专家们提示烤鸭,空间表达时需要注意区分:在空间状语里,in表内部,on表接壤,to表分开。 常用的空间词: lies 靠近
雅思小作文写作
Writing Notes Date: July, 9th, 2017 Task I 1.Three Types i.Data: Bar Chart, Line Graph, Table, Pie Chart ◆图表类型:动态图、静态图 ◆动态图:有两个或以上时间 ◆重点 ●趋势 ●特殊值:起点、重点、最高点、最低点、交叉点 ◆静态图:只有一个或者没有时间 ●比较描述对象:使用倍数、比较级 ii.Process: Flow Chart iii.Map ◆Describe the change ◆Eg: Hospital is located to the west of car park 2.评分标准 i.Task Achievement/ Task Response ◆Cover the Requirements of the task ◆No off topics ◆不能添加主观想法,只能描述 ii.Coherence and Cohesive ◆使用路标性词汇:顺承和转折 iii.Lexical Resource ◆使用非高频词汇 ◆Use words and phrases naturally and appropriately ◆Vocabulary diversity ◆Accurate spelling words iv.Grammatical Range and Accuracy ◆Accurate grammar of sentences ◆Use different ranges of sentences, structures to achiever grammatical 3.写作方法 i.开头段 ◆图表词改写 ●The chart : bar chart, line chart, pie chart, table, diagram ◆动词shows改写 ●注意时态 ●Shows: illustrates, gives information about, compares, indicates, demonstrates ◆关键词(一定要改写) ●数量改写 ?The number of + 可数 ?The amount of + 不可数 ?The quantity of + 可/不可数 ?The figure for +可/不可数 ●百分比改写
雅思图表作文满分一例 The table below gives information on consumer spending on different itemsin five different countries in 2002. Percentage of national consumer expenditure by category - 2002 构思过程: I know that I can write a short introduction by paraphrasing thequestion. I look for an overall trend. I can see that the food/drinks/tobaccocategory has the highest percentages, and leisure/education has the lowest. Now I want to write two main body paragraphs. I need to select something tosay about each country. Remember, there is no rule about what information youselect; everyone will do this differently. I look for the highest figures in each category: I can see that Turkey hasthe highest figure for food/drinks/tobacco AND for education/leisure. Italy hasthe highest figure for clothing/footwear. So, I'll write a paragraph about Turkey and Italy.
雅思写作地图题深度解析(上) 朗阁海外考试研究中心姜芮 在雅思小作文中,流程图和地图题无疑对于广大考生来说都有不小的威胁,很多考生在遇到此类型的题目时,会变得手足无措,不知道应该从何写起。许多考生抱着侥幸的心里,往往不重视此类小众题目的备考,结果作文分数受到了很大的影响。在本系列文章中,朗阁海外考试研究中心写作组的专家将着重对雅思写作地图题做一个深度解析。 我们用两个经典的地图题真题为例,在近两年出现的数次地图题中,多数都是属于这类“三格地图”。 WRITING TASK 1 You should spend about 20 minutes on this task. The diagram below shows the development of the village of Kelsby between 1780 and 2000.
Summarise the information by selecting and reporting the main features, and make comparisons where relevant. Write at least 150 words. 在审题过程中我们需要特别注意以下几点: 1. 时态:关注时态是小作文能否取得高分的关键,同样对于地图题,我们也应该很好地注意时态,本文的时间是明确的,都是过去的时间,因此全文应当使用一般过去时。 2. 顺序:该图属于动态的地图题,这种类型的地图题一律按照时间顺序来写。在这道题中,也就是按照图的顺序依次来写,不要把元素拆开。如果是静态的地图题(即不涉及时间变化的题型),则按照空间顺序来写。在描述单幅地图时,我们可以采取上北下南的顺序描述,或者从左到右的顺序也可以,但值得注意的是,如果地图上有明显的方向标示,那就要根据这个标示来描述。 下面我们一起来分析文章的写作。 第一段:Introduction 引言段就是把题目进行改写。原文中的diagram,可以替换成figure,原文中的shows,可以改为illustrate, demonstrate, reveal, indicate等词。宾语development,可以替换成transformations,也可以改为宾语从句how the village of Kelsby developed/ changed. 题目中给出的时间比较模糊,可以具体化为in 1780, 1860 and 2000. 【例文】The three maps illustrate how the village of Kelsby changed in 1780, 1860 and 2000. 第二段:描述1780年的地图 1780年的情况只涉及到静态的数据,因此只需要用存在句即可表达,不涉及任何变化的单词。但是,考生非常容易把这些元素全部用there be这个句型来表达,从而导致句式单一。表示存在的句型除了there be之外,还有非常简单的have句型,还有lie/ be located/ be situated这样的结构。另外还有一种倒装句型,比如“桌子上面有一本书”,可以翻译为on the desk is a book. 除此之外,要注意几个元素的顺序问题。这里有四大元素:住宅区homes,树林woods,农场farms,还有一条河流river。理论上只要按照一定的空间顺序(比如顺时针、逆时针,从左到右)都是可以的,但是要考虑家庭数量的变化是导致其它所有变化的根本原因,因此建议先写住宅区homes。 还有就是土地单位的表达,land是不可数名词,因此不能说a land,只能说a piece of land。为了表达更加精确,可以用a plot of land(一小块),a stretch of(一长片),a large expanse of(一大片)。 另外朗阁海外考试研究中心提醒考生们还要注意方位词的表达。地图题中常用的方位词有:in the east/ west/ south/ north of ...; in the eastern/ western/ southern northern part of ...; 如果是在角落,可以用in the southwestern corner of ...; 在河流的上/下游:at the lower/ upper reaches of the river; 在河岸:alongside the riverbank; 在河流的南端:at the southern end of the river.
Writing Notes Date: July, 9th, 2017 Task I 1.Three Types i.Data: Bar Chart, Line Graph, Table, Pie Chart ◆图表类型:动态图、静态图 ◆动态图:有两个或以上时间 ◆重点 ●趋势 ●特殊值:起点、重点、最高点、最低点、交叉点 ◆静态图:只有一个或者没有时间 ●比较描述对象:使用倍数、比较级 ii.Process: Flow Chart iii.Map ◆Describe the change ◆Eg: Hospital is located to the west of car park 2.评分标准 i.Task Achievement/ Task Response ◆Cover the Requirements of the task ◆No off topics ◆不能添加主观想法,只能描述 ii.Coherence and Cohesive ◆使用路标性词汇:顺承和转折 iii.Lexical Resource ◆使用非高频词汇 ◆Use words and phrases naturally and appropriately ◆Vocabulary diversity ◆Accurate spelling words iv.Grammatical Range and Accuracy ◆Accurate grammar of sentences ◆Use different ranges of sentences, structures to achiever grammatical 3.写作方法 i.开头段 ◆图表词改写 ●The chart : bar chart, line chart, pie chart, table, diagram ◆动词shows改写 ●注意时态 ●Shows: illustrates, gives information about, compares, indicates, demonstrates ◆关键词(一定要改写) ●数量改写 ?The number of + 可数 ?The amount of + 不可数 ?The quantity of + 可/不可数 ?The figure for +可/不可数
剑桥英语10雅思考官范文(大作文+小作文)
剑10 1-2 It is important for children to learn the difference between right and wrong at an early age. Punishment is necessary to help them learn this distinction. To what extent do you agree or disagree with this opinion? What sort of punishment should parents and teachers be allowed to use to teach good behavior to children? One important stage in a child’s growth is certainly the development of a conscience, which is linked to the ability to tell right from wrong. This skill comes with time and good parenting, and my firm conviction is that punishment does not have much of a role to play in this. Therefore I have to disagree almost entirely with the given statement. To some extent the question depends on the age of the child. To punish a very young child is both wrong and foolish, as an infant will not understand what is happening or why he or she is being punished. Once the age of reason is reached however, a child can be rewarded for good behavior and discouraged from bad. This kind but firm approach will achieve more than harsh punishments, which might entail many negative consequences unintended by the parents. To help a child learn the difference between right and wrong, teachers and parents should firstly provide good role modelling in their own behavior. After that, if sanctions are needed, the punishment should not be of a physical nature, as that merely sends the message that it is acceptable for larger people to hit smaller ones-an outcome which may well result in the child starting to bully others. Nor should the punishment be in any way cruel.
The development of Chorleywood village from 1868 to 1994. 思路: 1. 严格按照时间的推进进行描述,不可以出现倒序或是插叙的情况。 2. 物体的坐标词汇应该是绝对方位词:东西南北,物体的大小词汇应该是相对单位词:较大,较小,倍数等。 3. 线段的描述应该包含两方面:方向和动作。 4. 注意使用被动句来表达客观存在。 答案: The map shows the changes and development of Chorleywood village in Great Britain over a period of 126 years from 1868 to 1994. Chronologically, during the first 15 years from 1868 to 1883, Chorleywood was merely a very small village with two crossing main roads for its all transportation. From 1883 to 1922, with the expansion to the south, a new living area took shape and almost tripled the original scale. Besides, in 1909, a railway line, parallel with the east-bound main road, was built, linking the east and west, as well as forming Chorleywood Station. During the next period between 1922 and 1970, Chorleywood extended both eastward and westward and almost doubled the previous size. The year 1970 saw another big change of Chorleywood--the establishment of a south-bound motorway as the axis, which connected east-west main road with the railway. By 1994, there emerged 5 new resident places and some entertainment including Chorleywood Park and Golf course, all of which scattered along the two sides of the newly-built traffic system.(177)
雅思小作文开头段应该如何写 在雅思写作的小作文部分里,往往我们可以采纳“老三段”式的写法,以不变应万变,不论是线图,柱图,表格,饼图,亦或是流程图,我们都可以采用此种方式完成雅思小作文的写作。 那么老三段式的经典写法中,强调着第一段“开门见山”介绍出本文讨论内容,即改写题目。将必要内容进行改写,这样可以获得高分效应。 第二段“丰实的内容”尽量多地将图表中的信息表达明确,不时的需要我们之前总结的常用表达(敬请参见前几篇文章关于雅思作文经典表达介绍文章)。第三段也就是文章的最后一段,对全文进行一个总结概括即可。 本文将着眼于介绍雅思作文开头段的常用高频高分表达,希望对同学们准备雅思有所帮助。也请同学们积极准备! 五分表达: The chart depicts (that)…该图呈现出… The chart shows (that)… The figures/statistics show (that)… The diagram reveals … The chart illustrates (that)… 六分表达: The graph provides some interesting data regarding…该图为我们提供了有关…有趣数据。 The graph describes the trend of …这个图描述了…的趋势 As is shown/demonstrated/exhibited in the chart/diagram/chart/table…如图所示… According to the chart …根据这些表格… As is shown in the table…如图所示… This table shows the changing proportion of A and B from …to …该表格描述了…年到…年之间A与B的比例关系。 This graph,presented in the chart,shows the general trend in…该图呈现了…总的趋势。
10个雅思小作文的万能模板 雅思小作文对很多考生来说都是一个非常复杂而重要的任务,事前准备雅思小作文模版可以为大家节省很多的时间。现在就为大家总结了10个雅思小作文的万能模板,希望会对大家有所帮助。 1、通过第一个曲线图,我们可以知道____,也说明了结果是___ According to the first graph, it can be seen that ______________, it can also be concluded from it that ______________. 2、一张有趣、有教育意义的、(内容)的图片(这句模板在雅思小作文中的应用非常的广泛。) There is an interesting and instructive picture which goes like this: __________. 3、当前有一张涉及______的增长曲线图,许多人______,然而其他人倾向于___ Nowadays there is a growing concern over ______________. Many people like ______________, while others are inclined to ______________. 4、目前,共同之处是_________,许多人喜欢______因为_______除此之外还由于_____ Nowadays, it is common to ______________. Many people like______________ because ______________. Besides, ______________. 5、(图表所示)_____,就像许多其他事物,被____更加喜爱,然而这一观点正被________所抨击,一些人认为_________,他们指出___________ ______________, just like many other things, are preferred by ____________. While being attacked by the idea that ______________, some people consider ______________. They point that ______________. 6、每种事物都有两面性和________,是没有异议的,包括利和弊 Everything has two sides and ______________ is not an exception, it has both advantages and disadvantages. 7、_____作为_____被观察了许多年,但是人们现在像发现新大陆一样注视着它 For years ______________ had been viewed as ______________. But people are taking a fresh look at it now. 8、政府保证________,对于这份保证,大多数人做出了强烈地回应,因为_____ It has stipulated by the government that ______________. To this stipulation, many people respond actively because ______________.
表格图001 You should spend about 20 minutes on this task. The table below give information about Favorite Pastimes in different countries. Summarise the information by selecting and reporting the main features, and make comparisons where relevant. Write at least 150 words. model answer: This table clearly presents and compares favorable pastimes in eight different countries. The pastimes, across the top of the table, are analyzed in relation to each country. As can be seen, about 60% of Canadians, Australians and Americans like watching television. On the other hand, this figure is quite low for China where only 15% of people watch television. Predictably, Americans like music at 23%, whereas only 2 to 5% of people in the other countries feel the same way. 20% of people in England enjoy sleeping as a pastime whereas in Canada and the USA, for example, the figure is only 2%. Interestingly, the Chinese like hobbies the most at 50%, as opposed to only 20% in France. It isn't surprising that the highest percentage of beach-lovers is in Australia and the USA at 30%. It seems that pastimes of people of different nationalities may be influenced by a number of