https://www.doczj.com/doc/772202764.html, https://www.doczj.com/doc/772202764.html,/docs/i3a-cpiq-support/ Imatest I3A CPIQ support
SFR & Acutance – Color Uniformity – Lens Geometric Distortion & Chromatic Aberration – Texture
Starting with Imatest 3.9, Imatest provides strong support for I3A (International Imaging Industry Association)CPIQ (Camera Phone Image Quality) Phase 2 measurements. For further detail, you should purchase the CPIQ 2.0 Specifications & Test Methods document. We will start working on Phase 3 soon as soon as it’s available.
SFR and Acutance
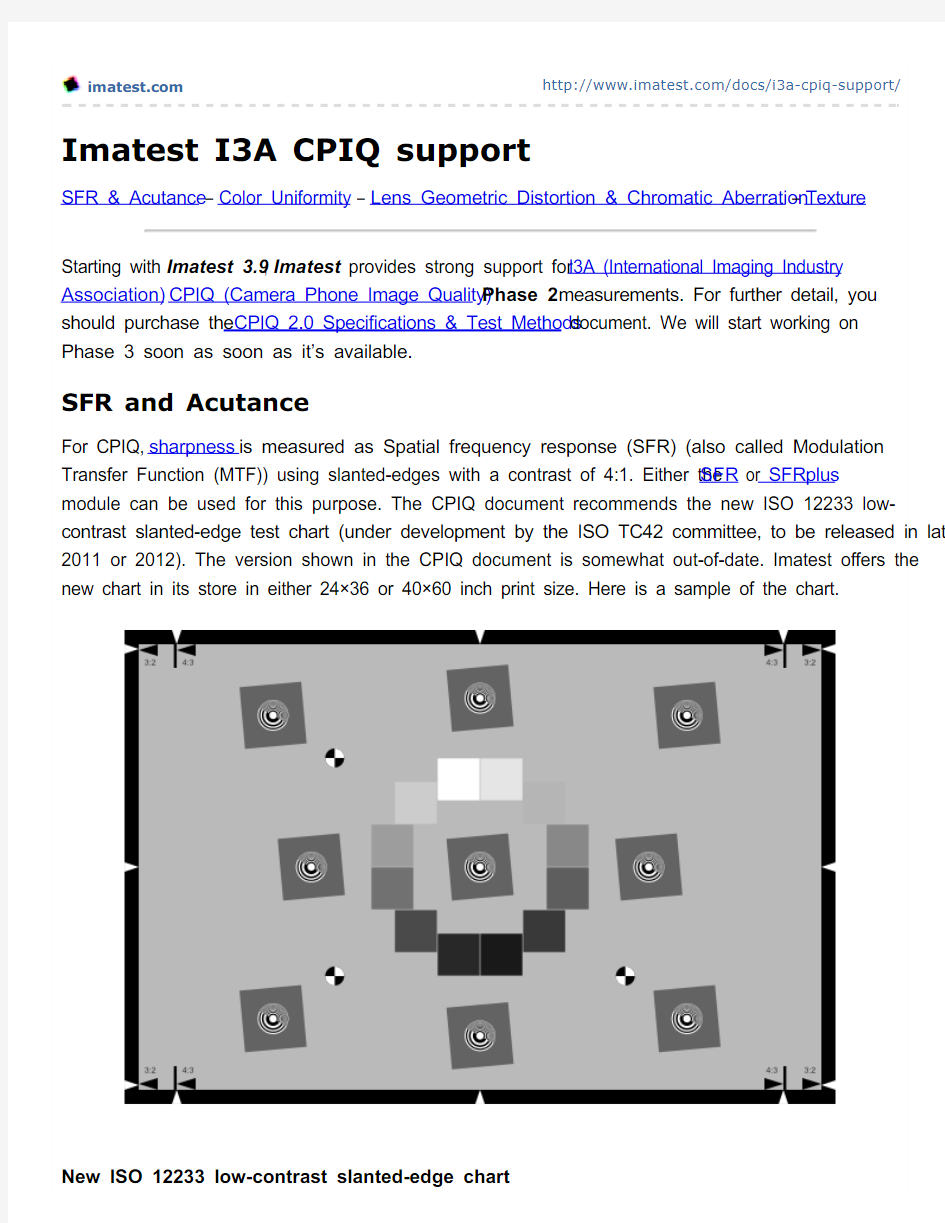
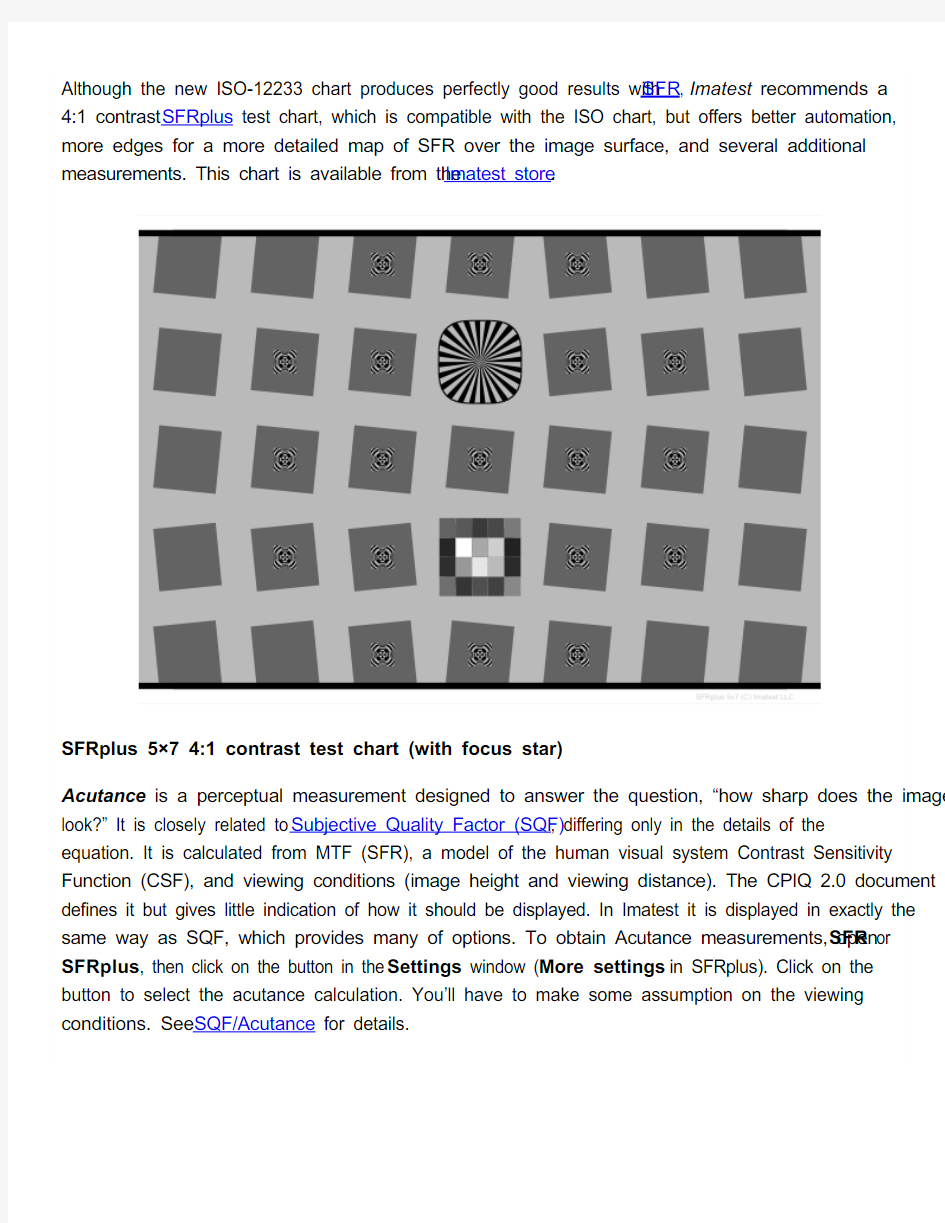
For CPIQ, sharpness is measured as Spatial frequency response (SFR) (also called Modulation Transfer Function (MTF)) using slanted-edges with a contrast of 4:1. Either the SFR or SFRplus module can be used for this purpose. The CPIQ document recommends the new ISO 12233 low-contrast slanted-edge test chart (under development by the ISO TC42 committee, to be released in late 2011 or 2012). The version shown in the CPIQ document is somewhat out-of-date. Imatest offers the new chart in its store in either 24×36 or 40×60 inch print size. Here is a sample of the chart.
New ISO 12233 low-contrast slanted-edge chart
SQF/Acutance settings window
Here are results. We have assumed that viewing distance is proportional to the square root of the print height (which fits my (NLK’s) experience of photography galleries). It can be fixed or have a cube root function.
Acutance results for viewing
distance = 20*sqrt(PH/10) or 15
cm, whichever is larger
for Picture height from 2 to 40
cm (0.8-16 inches)
Color variability
The CPIQ color variability metric, maximum ΔC, is displayed in Light Falloff and Uniformity-Interactive when Grid plot is set as follows.
Grid plot settings
Here is the resulting grid plot.
Random Scale-Invariant Settings window. Exponent set to 0 for
finding the response (exponent) of an original or undegraded Dead Leaves chart.
The PSD exponent measured with this setting (-1.35, below) is the exponent of the chart itself (assuming the image is representative of the original chart, which it is not in this example). The results below for the pattern from the CPIQ document, enlarged 400% (almost certainly magnified more than the original image, which explains the rapid PSD drop above 0.3 cycles/pixel).
PSD (NPS) response for the Dead Leaves image in the CPIQ Phase 2 document
Their appearance of the image below is very different, and this difference corresponds to their different Power Spectra. It has more low frequency response, hence a steeper rolloff (i.e., a larger PSD exponent: -2.149). Of course neither of these images are pure untouched representations of the original, so we can’t expect accurate results.
PSD (NPS) response for another Dead Leaves image. Very different exponent.
To run a proper system test, enter the measured MTF exponent for the chart (half the PSD exponent) into the Random Scale-Invariant Settings window. The Dead Leaves pattern is typically framed so it takes up about 1/3 of the image linearly (about 1/10 by area). This number may be vary depending on the chart design and the pixel size of the image (the pattern will require more space in low-resolution images such as VGA).
Imatest does not currently offer a Dead Leaves chart.