A Visualization Model for Information Resources Management
Zhou Ning1, Wu Jiaxin1, Wang Bing2, Zhang Shaolong1 1Research Center for Information Resources, Wuhan University, Wuhan 430072 China 2Computer Science Department, University of Hull, Hull,HU6 7RX UK
(n_zhouwhu@https://www.doczj.com/doc/9e15657240.html,)
Abstract
In general, digital inform ation resources can be
categorized into three categories, text, voice (audio) and
image (video). This article discusses a theoretical method
of information visualization system and its corresponding
technologies. The system is the results of the project
(70473068) supported by the National Natural Science
Foundation of China. The paper specifically discusses
constructing strategy of visualization
m odel,
environm ental configuration, functional m odule and operation m ethod of prototype system. What’s m ore, it further discusses construction of text, voice (audio) and image information visualization model, data preparation and data scale, operation interface and running result. The research represented is firstly a helpful attem pt in studying visualization m odel of general inform ation resources management with certain experience achieved, and secondly, it also explored a road to success in terms of visualization of information in Chinese.
Keywords visual model; model method; information resources management;
1.?Introduction?
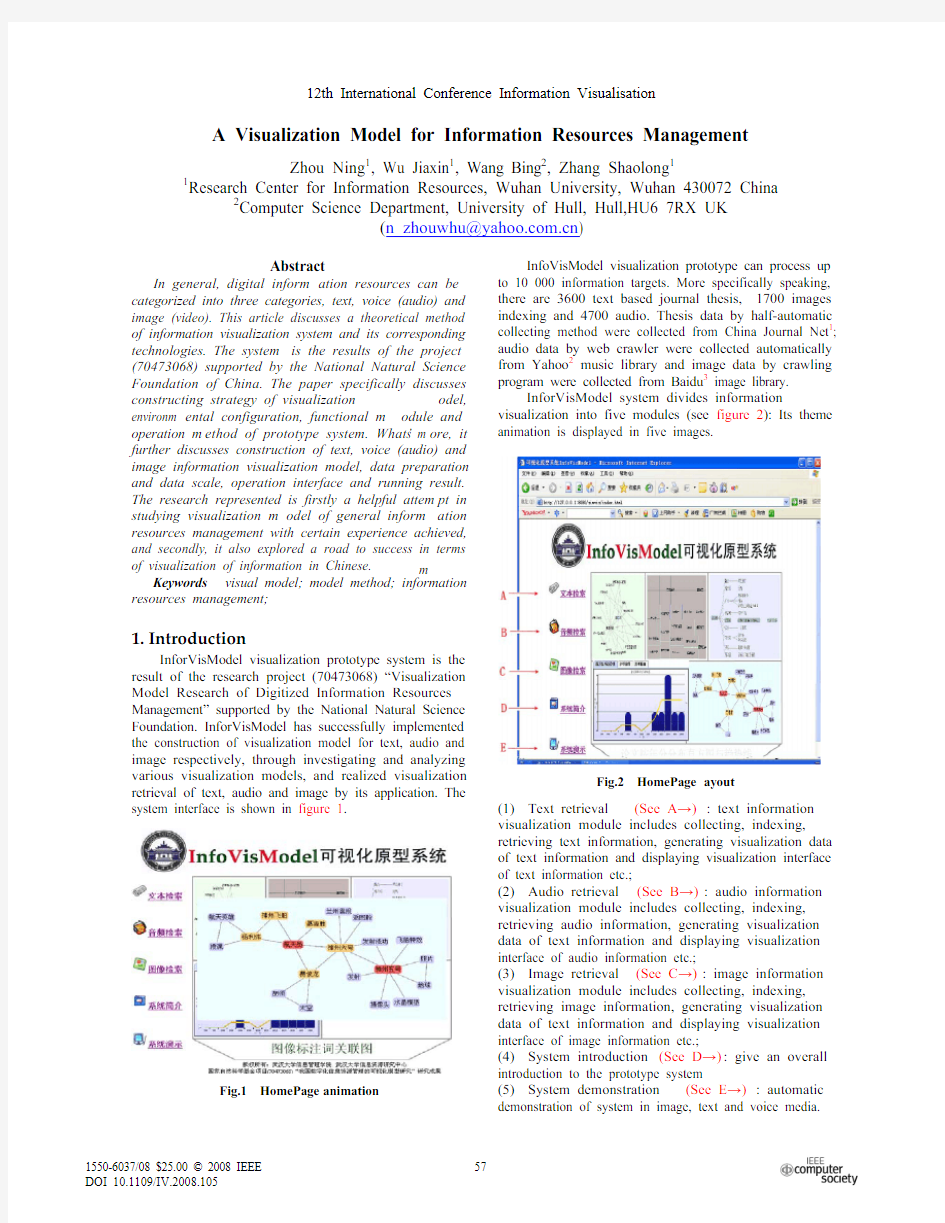
InforVisModel visualization prototype system is the result of the research project (70473068) “Visualization Model Research of Digitized Information Resources Management” supported by the National Natural Science Foundation. InforVisModel has successfully implemented the construction of visualization model for text, audio and image respectively, through investigating and analyzing various visualization models, and realized visualization retrieval of text, audio and image by its application. The system interface is shown in figure 1.
Fig.1 HomePage animation
InfoVisModel visualization prototype can process up
to 10 000 information targets. More specifically speaking, there are 3600 text based journal thesis, 1700 images indexing and 4700 audio. Thesis data by half-automatic collecting method were collected from China Journal Net1; audio data by web crawler were collected automatically from Yahoo2 music library and image data by crawling program were collected from Baidu3 image library.
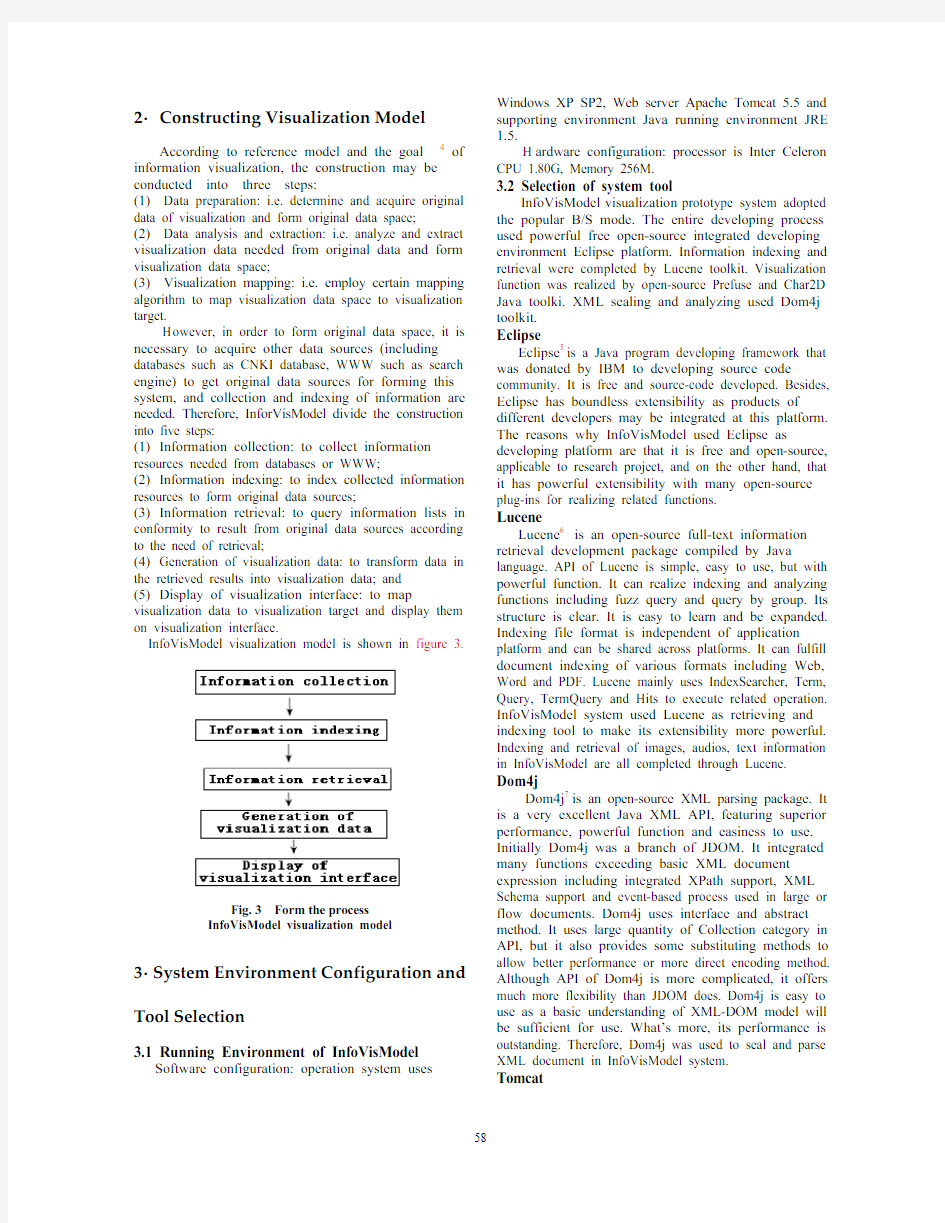
InforVisModel system divides information visualization into five modules (see figure 2): Its theme animation is displayed in five images.
Fig.2 HomePage ayout
(1)Text retrieval (See A?): text information visualization module includes collecting, indexing, retrieving text information, generating visualization data
of text information and displaying visualization interface
of text information etc.;
(2)Audio retrieval (See B?): audio information visualization module includes collecting, indexing, retrieving audio information, generating visualization data of text information and displaying visualization interface of audio information etc.;
(3)Image retrieval (See C?): image information visualization module includes collecting, indexing, retrieving image information, generating visualization data of text information and displaying visualization interface of image information etc.;
(4)System introduction (See D?): give an overall introduction to the prototype system
(5)System demonstration (See E?): automatic demonstration of system in image, text and voice media.
12th International Conference Information Visualisation
2ˊConstructing?Visualization?Model? According to reference model and the goal 4 of
information visualization, the construction may be conducted into three steps:
(1) Data preparation: i.e. determine and acquire original data of visualization and form original data space;
(2) Data analysis and extraction: i.e. analyze and extract visualization data needed from original data and form visualization data space;
(3) Visualization mapping: i.e. employ certain mapping algorithm to map visualization data space to visualization target.
H owever, in order to form original data space, it is necessary to acquire other data sources (including databases such as CNKI database, WWW such as search engine) to get original data sources for forming this system, and collection and indexing of information are needed. Therefore, InforVisModel divide the construction into five steps:
(1) Information collection: to collect information resources needed from databases or WWW;
(2) Information indexing: to index collected information resources to form original data sources;
(3) Information retrieval: to query information lists in conformity to result from original data sources according to the need of retrieval;
(4) Generation of visualization data: to transform data in the retrieved results into visualization data; and
(5) Display of visualization interface: to map visualization data to visualization target and display them on visualization interface.
InfoVisModel visualization model is shown in figure 3.
Fig. 3 Form the process InfoVisModel visualization model 3ˊSystem?Environment?Configuration?and?????????
Tool?Selection?
3.1 Running Environment of InfoVisModel
Software configuration: operation system uses
Windows XP SP2, Web server Apache Tomcat 5.5 and supporting environment Java running environment JRE 1.5.
H ardware configuration: processor is Inter Celeron CPU 1.80G, Memory 256M.
3.2 Selection of system tool
InfoVisModel visualization prototype system adopted
the popular B/S mode. The entire developing process used powerful free open-source integrated developing environment Eclipse platform. Information indexing and retrieval were completed by Lucene toolkit. Visualization function was realized by open-source Prefuse and Char2D Java toolki. XML sealing and analyzing used Dom4j toolkit.
Eclipse
Eclipse 5 is a Java program developing framework that was donated by IBM to developing source code community. It is free and source-code developed. Besides, Eclipse has boundless extensibility as products of different developers may be integrated at this platform. The reasons why InfoVisModel used Eclipse as developing platform are that it is free and open-source, applicable to research project, and on the other hand, that it has powerful extensibility with many open-source plug-ins for realizing related functions.
Lucene
Lucene 6 is an open-source full-text information retrieval development package compiled by Java language. API of Lucene is simple, easy to use, but with powerful function. It can realize indexing and analyzing functions including fuzz query and query by group. Its structure is clear. It is easy to learn and be expanded. Indexing file format is independent of application platform and can be shared across platforms. It can fulfill document indexing of various formats including Web, Word and PDF. Lucene mainly uses IndexSearcher, Term, Query, TermQuery and Hits to execute related operation. InfoVisModel system used Lucene as retrieving and indexing tool to make its extensibility more powerful. Indexing and retrieval of images, audios, text information in InfoVisModel are all completed through Lucene.
Dom4j
Dom4j 7 is an open-source XML parsing package. It is a very excellent Java XML API, featuring superior performance, powerful function and easiness to use. Initially Dom4j was a branch of JDOM. It integrated many functions exceeding basic XML document expression including integrated XPath support, XML
Schema support and event-based process used in large or
flow documents. Dom4j uses interface and abstract method. It uses large quantity of Collection category in
API, but it also provides some substituting methods to allow better performance or more direct encoding method.
Although API of Dom4j is more complicated, it offers much more flexibility than JDOM does. Dom4j is easy to use as a basic understanding of XML-DOM model will be sufficient for use. What’s more, its performance is outstanding. Therefore, Dom4j was used to seal and parse
XML document in InfoVisModel system.
Tomcat
Tomcat8 server is a free open-source code Web application server. It is a core project in Jakarta projects
of Apache software foundation, jointly developed by Apache, Sun and other companies and individuals. Running of Tomcat occupies little system resource with good extensibility, supporting functions generally used in developing application system such as loading balance and mail service. Tomcat belongs to small-sized light application server and is generally used in small and medium-sized system and occasions with fewer concurrent accessing users. For InfoVisModel prototype system, functions and performance of Tomcat is sufficient. Therefore, Tomcat was used to erect Web application server based on B/S.
4ˊVisualization?Model?of?Text?Information?
Construction process of text information visualization model in InforVisModel system is as follows: The model realized automatic/half-automatic collection of text information. Collected text information was provided to indexing module in XML form. Text indexing module generated text indexing database i.e. original text data source of prototype system through establishing indexing in source text XML base. After user submitted retrieval type, text information retrieval module search documents matching the demand in the indexing database. Text information visualization data generation module will generate two XML documents9 from key words information in retrieval list. Key words distributed XML and key words association XML, visualization data support for visualization displaying module of text information was provided. Text information visualization interface not only displayed keywords distribution map, keywords relevance diagram, chronological distribution histogram of thesis, but also gave related retrieving lists and other information of retrieving results.
Therefore, visualization model of text information mainly used XML as interface of data transformation. Final result of original text information collection was submitted in XML document while visualization data used XML interface provided by Prefuse. Usage of XML as data interface may increase extensibility of system. For example, the system may accept data from other text information sources as long as these text information sources may be transformed into system-defined source text XML format. The system can then make it automatic indexing to add to indexing database and become original data source of this system. Visualization data format based on XML can better meet the demand of various visualization displaying forms such as various point-linear, filling, tree structures.
Text information visualization mainly realized visualization of keywords association and distribution by utilizing RadialGraphView and Treemap provided by Prefuse and Histogram offered by Char2D. The principle of keywords association visualization is that there is relationship among indexed keywords in the same literature and a network formed by keywords of several literatures in certain field represents the knowledge structure of this subject, and that the essence of association words visualization is to reveal knowledge structure through the relationship between keywords. And the relationship of keywords is determined on the basis of word co-occurrence principle. Keywords distribution visualization is to put literatures with the same indexing keywords into one hieratical structure to form a tree-structure, in which tree structure used filling tree – Treemap for fulfillment. Not only hieratical structure relationship was given, but also other quantitative indexes such as literature of the same keywords were also reflected. The essence of keywords visualization is to reveal the relationship between keywords and literature to gather related literatures with the same keywords. Chronological distribution histogram of thesis displayed numbers of published thesis in different years in the research field corresponding to queried words, thus vividly analyzing whether this field may be a research focus or a mature research field etc.
Text information visualization interface includes five parts (overall interface of text information retrieving visualization is shown in figure 4)
:
Fig.4 Text information visualization interface
(1)Query input textbox
User inputs keywords in this textbox to submit for query by pressing enter or clicking. If user inputs “information visualization”, this input will be parsed as query character string and Lucene will take the string as the input to index and generate result lists and extract information from result lists at the same time, keywords relationship XML, keywords distribution XML and chronological distribution frequency data of literature respectively. Finally it is displayed to the user in a visualization way.
(2) Visualization map of literature publishing time
This map is generated by an Applet (H istogram
class). This Applet calls Chart 2D.jar which is a toolkit
used in performing 2D visualization. It can conveniently
draw histogram, dot graph, linear graph and pie etc. In
order to generate trend map, it is needed to input literature
frequency counted in collection of literature in query
result. Use “information visualization” as query character
string and finally 9 theses are targeted, while datastring
corresponding to histogram is ““0,0,0,0,0,0,0,0,0,3,1,4,1”,
and its corresponding histogram is shown at the up right
part in figure 4.
In the figure, the ordinate represents thesis numbers
and the abscissa stands for different years. The literature
publishing time visualization map, besides histogram and
trend-line, includes distribution curve and distribution
surface (see the figure).
From the literature publishing time visualization map, the rule of literature publishing according to time
can be clearly seen, which is conducive to analyzing and
querying the research cycle of the keywords-corresponding research field, whether it is a
hotspot and degree of being concerned in different times.
Therefore, it helps user to grasp characteristics and rules
of the research field in a macro way and provides instructive suggestions for writing thesis and reading.
Take “information visualization “ as an example, the
result shows that publishing rate in 2005 was the highest,
which means 2005 witnessed the research hotspot, while
the heat decreased in 2006 as it can be seen that the peak
value has decreased and tending to be slow and flat from
the trend map.
(3) Radial Graph View
This view is generated by Applet with kmRelation.xml as data input. It reflects the relevance among keywords in the result collection of literature query. In Radial Graph, when clicking certain node, the program will take the present node as the root and use breadth traversal algorithm to do traversing with the present node as the initial one, and then acquire parent-child relationship among nodes to generate a tree. Nodes in the tree are corresponding to the ones in the map. Each node in the tree (except the root node) takes one of its neighbors in the map as parent node. When displaying the generated tree, “Radial drawing” method is used to draw. Each node is aligned on several rings that have root node as the centre. The depth at which the node is determines which ring the node is on. The deeper it is, the
farther it is away from root node (the present node) and
the farther ring it is away from the root.
For Radial Graph, with the present node as the
centre, divergence map expanding to the outside may be
divided into several sectors. The location where each
node on the ring is determined by the sector assigned to
this node by this ring. Each node is located in the sector
of its parent node, while the opening angle of sector is
proportional to the angular width of the child-tree of this
node. This method is called “Radial Placement”. Among
them, all the nodes are of the same size, and the angular
width is determined by the number of leaf node in the descendent of this node child tree. Besides drawing each node and side statically, Radial Graph also supports dynamic interaction. When the node changes the visualization map will change dynamically. User will see the changing process of map instead of another static map. Radial Graph View can not only display keywords of each thesis in the query result, but also relationship between keywords. Through displaying these relationships, user’s thought may be extended so that correlation of different fields and closely related fields may be found out, and the user may have an all-round knowledge on keywords-related fields. What’s more, it may help user to find new query words, playing a role in keywords recommendation. Through restricting more keywords, the query scope is reduced. Dynamic interaction of Radial Graph View can make the user to
focus on the present node and dynamically and gradually find the change of keywords relevance. (4) TreeMap
This map is generated by Applet and takes kwDistribution.xml as data input. It reflects literature distribution frequency of each keyword. If “information visualization” appeared in eight articles in a query result,
its frequency is 8. TreeMap can vividly display how many theses each keyword has appeared on the present page, which is favorable to observing the distribution characteristics of keywords and discovering the popular degree of the keyword-corresponding research field. Take “information visualization” query result as an example, 9 articles were found out, 8 were contained on the first page. Its keyword distribution TreeMap is shown in figure 4 (4). Because each article contains the keywords “information visualization”, there were also 8 rectangular frames corresponding to information visualization. The keywords “Method Study” appeared in 2 articles, so there are only 2
frames corresponding to the keywords. (5) Retrieval targeting result frame If there are many targeted results, it can be managed by the page. Page number is listed under this frame. Needed page may be chosen freely according to the need. A click will immediately open the needed page showing the result lists of this part. 5ˊVisualization?Model?of?Audio?Information?Construction process of InfoVisModel system audio information visualization model is as follows: collection of audio information was completed through crawler crawling Yahoo music library and the collected audio information was provided to audio information indexing module in XML. The audio indexing module established indexing of source audio XML library and generated audio indexing database, i.e. audio original data source of prototype system. After user submitted retrieval type
through retrieval interface, audio information retrieval module searched audio information matching the demand in the indexing database. The audio information visualization data generation module used artist, name of album and song etc. to generate music tree XML to provide visualization data support for audio information visualization displaying sub-module. Audio information visualization not only displayed music map, but also gave other information in the retrieval result.
Generation of music tree is based on artist, name of album and song when people retrieve audio information (here only music information is taken as the major example). Through retrieving result, the hieratical structure with the sequence of “artist-album-song” will be generated. It provides not only the information in the most concerning aspects provided but also the relevance diagram among them and automatic categorization of retrieving result is realized. Gathering works and albums by the same artist is convenient for both related retrieving and for people retrieving and using audio information. Here visualization display of music tree was realized by using TreeView in Prefuse10.
Audio information visualization interface contains three parts (as is shown in figure 5
):
Fig. 5 Audio information Visualization interface (1)Query input textbox
User inputs keywords in this textbox to submit for query by pressing enter or clicking. If user inputs “love”, this input will be parsed as query character string and Lucene will take the string as the input to index the name of the song and generate result lists of the song containing “love”. It will then output song information and generate MusicTree.xml for the use of visualization display.
(2)Music tree view
This view is a transverse tree directory. Under initial state, 3 directories are displayed: root, grade I and grade II directories. When user clicks certain directory, two sub-directories of this directory will be dynamically displayed. So the view can be restricted within effective area and will not make the display space insufficient because of huge depth of directory. Grade I directory of music tree is name of singer, singers contained in the targeted results; grade II directory is the album of this sing; grade II directory is name of specific targeted song belonging to certain album. “Like” was used as character string to make initialized map of music tree. (3)Song lists
Display the retrieved songs in the form of list. Information of each song includes name of singer, album and name of song.
6ˊVisualization?Model?of?Image?????Information?
Construction process of InfoVisModel system image information visualization model is as follows: collection of image information was mainly completed through automatic crawling image library of Baidu search engine. The collected image information was provided to image information indexing sub-module in the form of XML. Image indexing sub-module established indexing of source image XML library and generated image indexing database i.e. image original data source of prototype system. After user submitted retrieving type through retrieving interface, image information retrieval module searched image information matching the demand in the indexing database. Image information visualization data generation module used information including image ID and keywords generated image keywords association XML and provided visualization data support for image information visualization display sub-module. Image information visualization interface not only displayed image keywords relevance map, but also gave other information in retrieving results.
Image keywords relevance map was mainly based on the correlation among the marked keywords in image. It associated keywords of many images, which is helpful for user to search more proper keywords for further query. Visualization display of image keywords relevance diagram was realized by GraphView11 in Prefuse. Visualization interface of image information contains three parts (as is shown in figure 6):
(1)Query input textbox
User inputs keywords in this textbox to submit for query by pressing enter or clicking. If user inputs “China airship”, this input will be parsed as query character string and Lucene will take the string as the input to index image description and image keywords and generate result lists of images. It will then output image information and generate ImageGraph.xml used in visualization display.
(2)Image – keywords relevance diagram
This is a visualization map generated on the basis of data structure of map. The visualization model it adopts is Force Directed Model. It is a visualization model based
on physical method. This model regards each node as particle and side between nodes as function of force or repulsion force or attraction force. When mutual function of force reaches balance, it becomes the final visualization view. So, visualization view is a result of the action of forces. From the perspective of aesthetics, when forces are balanced, visualization display of view is the most beautiful. Input “Shenzhou V” as query character string, initialized effect of image-keywords relevance diagram can be seen in figure 6. The keywords “Shenzhou V” node is seated in the middle of the diagram. Connect related images (integral ID node) through lines; keywords representing these images all contain “Shenzhou V”. It can be seen from the figure, that besides “Shenzhou V”, the three key phrases “Shenzhou
VI”,
Fig. 6 Visualization interface of image information “Shenzhou Airship” and “Yang Liwei” are all connected to many images.
(3)Lists of image results
It shows results of images in the form of table, attached with ID, width, length, memory size and format of images.Conclusions???
To summarize, visualization model of information resources management is divided into image, text and audio for handling. They respectively experience the three stages i.e. data preparation, data analyzing and extraction and visualization mapping. The generation process of this kind of visualization model has not only provided method for construction visualization model of general information resources management, but also explored a road to success in visualization of information resources in Chinese. And the completion of the study of InfoVisModel prototype system has proved a successful example.
Acknowledgements
This research was supported by the National Natural Science Foundation of China?NSFC?under Grant 70473068.
References
[1] https://www.doczj.com/doc/9e15657240.html,//index.htm
[2] https://www.doczj.com/doc/9e15657240.html,/
[3] https://www.doczj.com/doc/9e15657240.html,/
[4] Chaomei Chen. Mapping Scientific Frontiers: The Quest Knowledge Visualization. London:. Springer-Verlag 2003 28-29
[5] https://www.doczj.com/doc/9e15657240.html,/
[6] https://www.doczj.com/doc/9e15657240.html,/
[7] https://www.doczj.com/doc/9e15657240.html,/
[8] https://www.doczj.com/doc/9e15657240.html,/
[9] Zhou Ning, Zhang Yufeng, Zhang Liyi. Information Visualization and Knowledge Retrieval. Beijing: Science Press 2005 306-314
[10] http:// https://www.doczj.com/doc/9e15657240.html,/
[11] http:// https://www.doczj.com/doc/9e15657240.html,/