OECD-WTO Database on Trade in Value added
First Estimates: 16 January 2013
Global value chains (GVCs) have become a dominant feature of today’s global economy. This process of international fragmentation, driven by technological progress, cost, access to resources and markets, and trade policy reforms, challenges our conventional wisdom on how we look at and interpret trade and, in particular, the policies that we develop around it. Traditional measures of trade, that record gross flows of goods and services each and every time they cross borders, alone, may lead to misguided decisions being taken.
The OECD and the WTO have therefore undertaken a joint initiative to develop a database of Trade in Value added (TiVA) indicators and to mainstream their production within the international statistics system; the preliminary results will be launched on 16 January 2013.
This note presents a broad overview of the first results from that initiative and an indication of future plans.
What is Trade in Value Added?
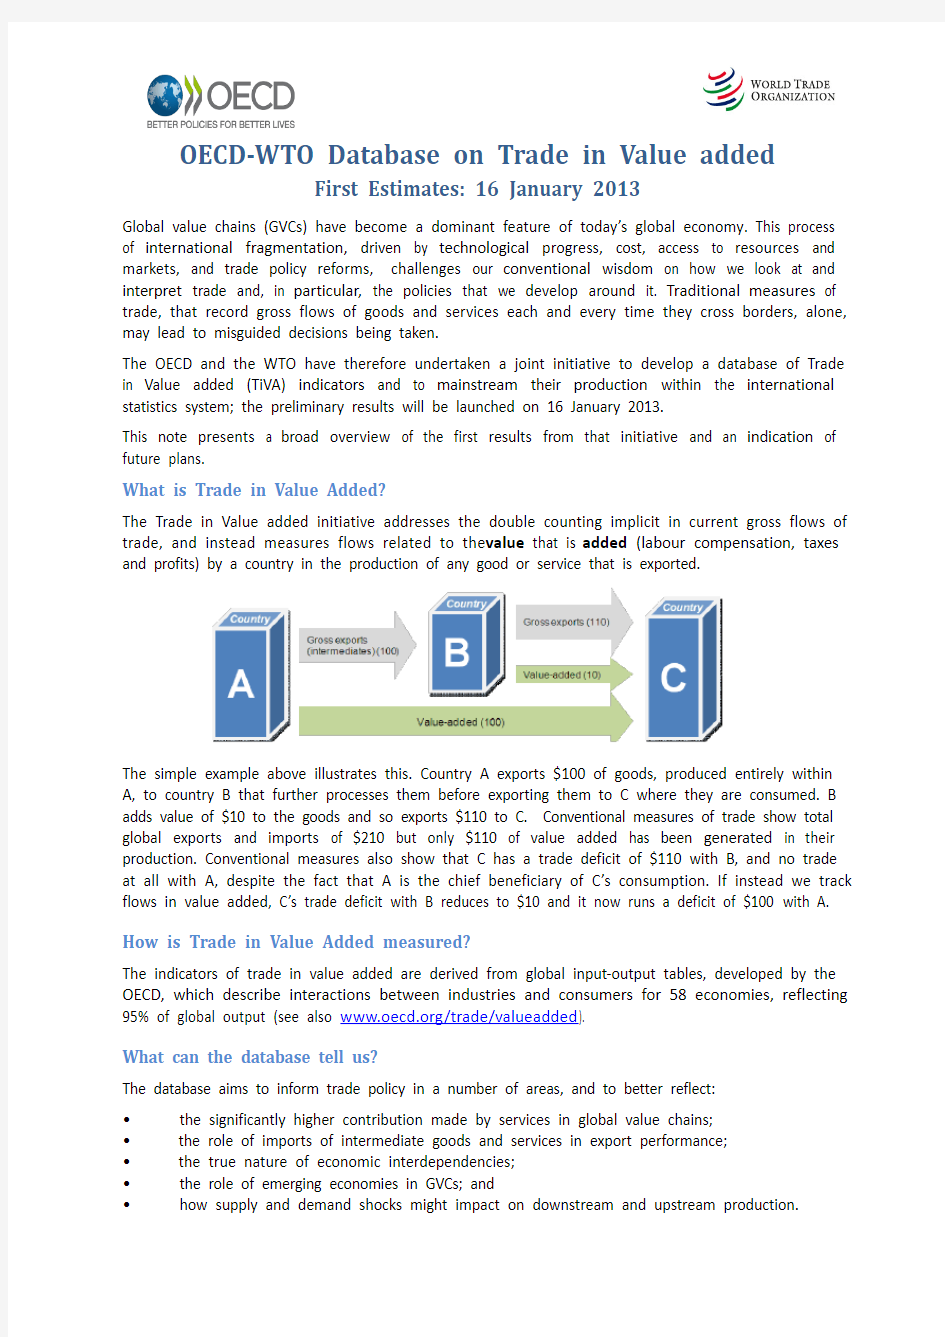
The Trade in Value added initiative addresses the double counting implicit in current gross flows of trade, and instead measures flows related to the value that is added (labour compensation, taxes and profits) by a country in the production of any good or service that is exported.
The simple example above illustrates this. Country A exports $100 of goods, produced entirely within A, to country B that further processes them before exporting them to C where they are consumed. B adds value of $10 to the goods and so exports $110 to C. Conventional measures of trade show total global exports and imports of $210 but only $110 of value added has been generated in their production. Conventional measures also show that C has a trade deficit of $110 with B, and no trade at all with A, despite the fact that A is the chief beneficiary of C’s consumption. If instead we track flows in value added, C’s trade deficit with B reduces to $10 and it now runs a deficit of $100 with A. How is Trade in Value Added measured?
The indicators of trade in value added are derived from global input-output tables, developed by the OECD, which describe interactions between industries and consumers for 58 economies, reflecting 95% of global output (see also https://www.doczj.com/doc/aa1828715.html,/trade/valueadded).
What can the database tell us?
The database aims to inform trade policy in a number of areas, and to better reflect:
?the significantly higher contribution made by services in global value chains;
?the role of imports of intermediate goods and services in export performance;
?the true nature of economic interdependencies;
?the role of emerging economies in GVCs; and
?how supply and demand shocks might impact on downstream and upstream production.
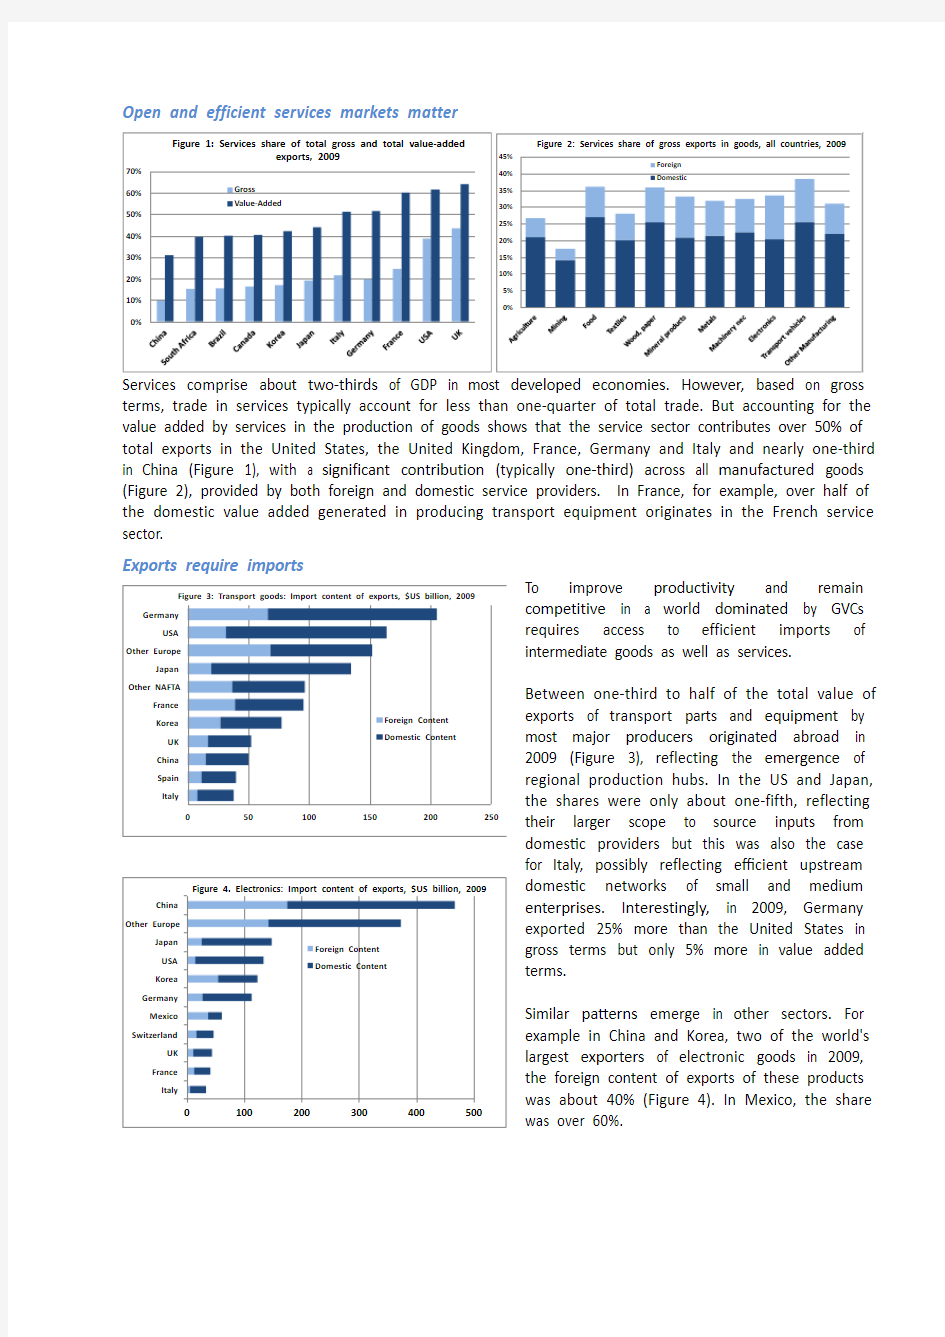
Open and efficient services markets matter
terms, trade in services typically account for less than one-quarter of total trade. But accounting for the value added by services in the production of goods shows that the service sector contributes over 50% of total exports in the United States, the United Kingdom, France, Germany and Italy and nearly one-third in China (Figure 1), with a significant contribution (typically one-third) across all manufactured goods (Figure 2), provided by both foreign and domestic service providers. In France, for example, over half of the domestic value added generated in producing transport equipment originates in the French service sector.
Exports require imports
To improve productivity and remain competitive in a world dominated by GVCs requires access to efficient imports of intermediate goods as well as services.
Between one-third to half of the total value of exports of transport parts and equipment by most major producers originated abroad in 2009 (Figure 3), reflecting the emergence of regional production hubs. In the US and Japan, the shares were only about one-fifth, reflecting their larger scope to source inputs from domestic providers but this was also the case for Italy, possibly reflecting efficient upstream domestic networks of small and medium enterprises. Interestingly, in 2009, Germany exported 25% more than the United States in gross terms but only 5% more in value added terms.
Similar patterns emerge in other sectors. For example in China and Korea, two of the world's largest exporters of electronic goods in 2009, the foreign content of exports of these products was about 40% (Figure 4). In Mexico, the share was over 60%.
And significant shares of intermediate imports are used to produce exports
In most economies, around one-third of intermediate imports are destined for the export market. Not surprisingly, typically, the smaller the economy the higher the share, but even in the United States and Japan these shares are 15% and 20% respectively at the total economy level, with higher incidence of intermediate imports in some highly integrated industries.. In Japan for example nearly 40% of all intermediate imports of transport equipment end up in exports.
In most other countries, the share of
intermediate imports embodied in exports is
significantly higher. In Hungary, for example
two-thirds of all intermediate imports are
destined for the export market after further
processing, with the share reaching 90% for
electronic intermediate imports. In China, Korea
and Mexico around three-quarters of all
intermediate imports of electronics are
embodied in exports. The TiVA database also
shows that close to 85% of China's intermediate
imports of textile products end up in exports. Intermediate imports often embody a country's own (returned) domestic value added
Imports can also contain ‘returned’ value added
that originated in the importing country. In the
United States for example nearly 5% of the total
value of imported intermediate goods reflects
US value added (Figure 6). In China the
equivalent shares are close to 7%.
For electronic goods, Chinese intermediate
imports contain over 12% of “returned” Chinese
domestic value added, and Korean intermediate
imports contain close to 5% of "returned"
Korean domestic value added.
What you see is not what you get: Trade patterns change
Bilateral trade balance positions can change
significantly when measured in value added
terms, although the total trade balance is
unaffected. China's bilateral trade surplus with
the United States was over USD 40 billion (25%)
smaller in value added terms in 2009 for
example (and 30% smaller in 2005). This partly
reflects the higher share of US value added
imports in Chinese final demand (Figure 7) but
also the fact that a significant share (one-third)
of China's exports reflect foreign content - the
“Factory Asia” pheno menon.
For example, significant exports of value added from Korea and Japan pass through China on their way to final consumers, resulting in significantly smaller Chinese trade deficits with these countries but also typically higher Japanese and Korean trade surpluses with other countries. Similarly Korea's significant trade deficit with Japan in gross terms almost disappears when measured in value added terms
Database Content
The current release includes data for 40 countries (all OECD countries, Brazil, China, India, Indonesia, the Russian Federation and South Africa) covering 2005, 2008 and 2009, with a breakdown into 18 industries. Indicators in the database include:
?gross exports by industries broken down into their domestic and foreign content, with the domestic content split into three (direct, indirect and re-imported) components and the foreign content broken down by source country;
?services content of gross exports by exporting industry (broken down by foreign/domestic origin);
?bilateral trade balances based on flows of value added embodied in domestic final demand;
?Intermediate imports embodied in exports, as a per cent of total intermediate imports.
Future Releases
This release reflects the first provisional estimates from this exercise. Future releases will see an expansion in: the number of countries covered and industry disaggregation; the time period covered, where work is planned to go back to 1995 data; the number of indicators; and degree of detail presented.
Statistical Quality
It is important to stress that the indicators shown in the TiVA database are estimates. Official gross statistics on international trade produced by national statistics institutions result in inconsistent figures for total global exports and total global imports; inconsistencies which are magnified when bilateral partner country positions are considered. The global input-output tables from which TiVA indicators are derived, necessarily eliminate these inconsistencies, such as those that reflect different national treatments of re-exports and transit trade (e.g. through hubs such as the Netherlands and Hong Kong), to achieve a coherent picture of global trade. For the countries for which data is presented, total exports and imports are consistent with official national accounts estimates. But bilateral trade positions presented in the database (based on gross flows) and those published by national statistics institutions may differ. Work is on-going within the international statistics community to achieve coherence in international trade flows, particularly in the area of trade in services, where significant differences exist when comparing national statistics.
Accessing the Database
The OECD-WTO TiVA database can be accessed via the OECD's Statistics Portal https://www.doczj.com/doc/aa1828715.html,/ under the theme "International Trade and Balance of Payments" and through WTO's portal https://www.doczj.com/doc/aa1828715.html,/miwi
For more information on the methodology behind the TIVA database and indicators see https://www.doczj.com/doc/aa1828715.html,/trade/valueadded.
For any queries on the database please contact: TIVA.contact@https://www.doczj.com/doc/aa1828715.html,