Recurrent Artificial Neural Networks for
the Detection of Oil Spills from Doppler Radar Imagery
Tom Ziemke
The Connectionist Research Group1
Dept. of Computer Science
University of Sk?vde
S-54128 Sk?vde/Sweden
tom@ida.his.se
August 1995
Abstract
This paper discusses the application of artificial neural networks (ANNs) to the detection of oil spills in sea clutter environments from the classification of radar backscatter signals. A comparison and evaluation of different network architectures regarding reliability of detection and robustness to varying sea states/wind conditions shows that for this problem best results are achieved with a recurrent architecture similar to that of Elman's SRN.
1Introduction
The design of systems for the classification/identification of objects from the measurements of their radar back-scatter signals has traditionally been based upon mathematical/decision-theoretic methods of pattern recognition. The applicability of such methods, due to their mathematical nature, crucially depends on the availability of suffi-ciently accurate models for the statistical properties of the radar measurements.
The problem domain discussed here however, the discrimination of oil spills from water areas in Doppler radar images, is particularly characterised by the lack of such formal knowledge. Therefore ANNs, due to their 'mo-del-freedom', offer an attractive alternative to this problem, since they are able to learn to perform the classification from labelled training data, and do not require a-priori knowledge of statistical models.
The work presented here is part of a long-term joint project on ANNs and radar signal processing between The Connectionist Research Group, University of Sk?vde/Sweden and Ericsson Microwave Systems, M?lndal/Sweden. 2Problem Domain
2.1General idea
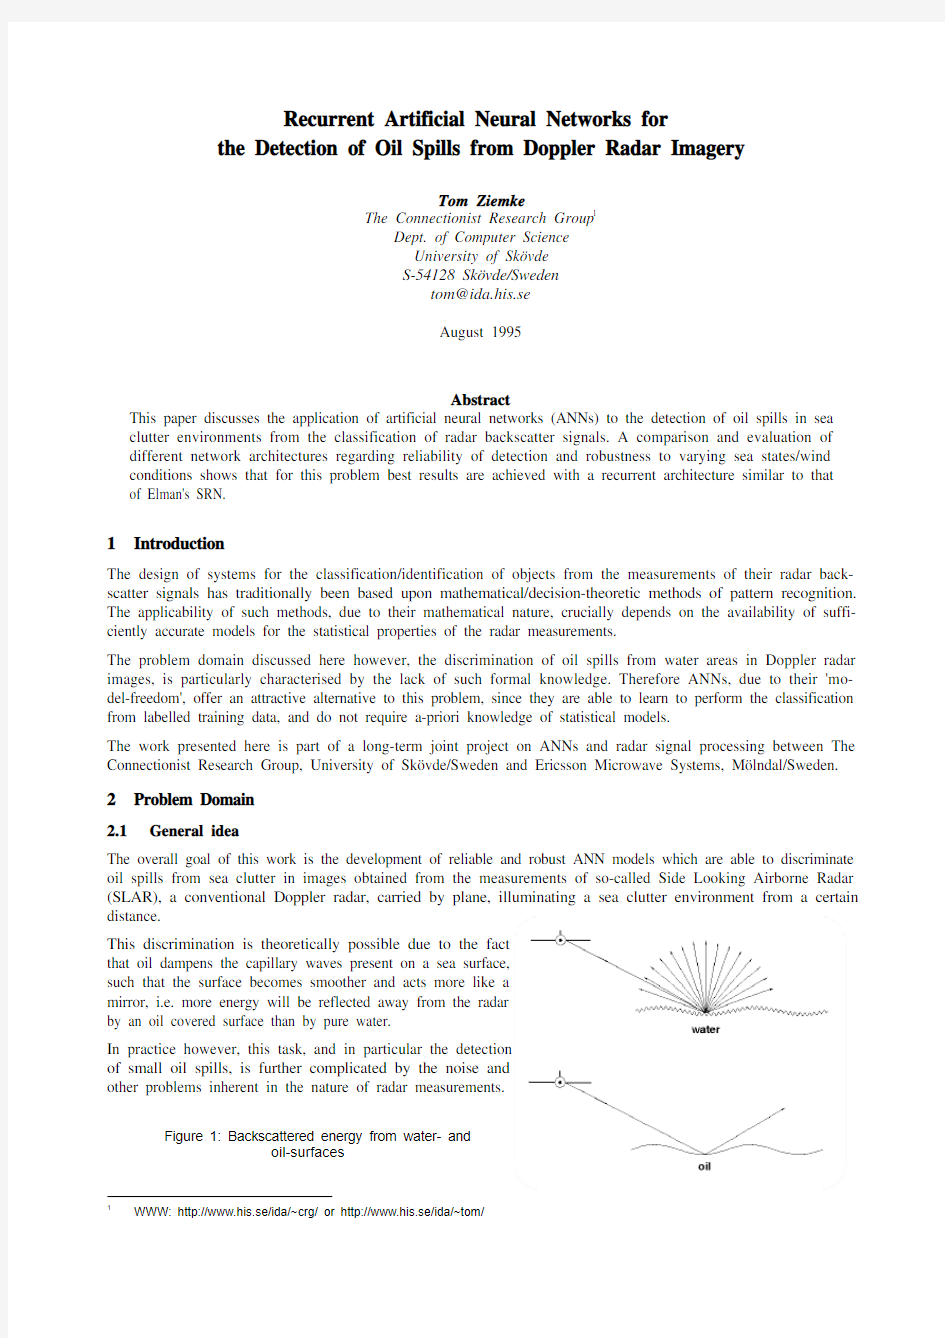
The overall goal of this work is the development of reliable and robust ANN models which are able to discriminate oil spills from sea clutter in images obtained from the measurements of so-called Side Looking Airborne Radar (SLAR), a conventional Doppler radar, carried by plane, illuminating a sea clutter environment from a certain distance.
This discrimination is theoretically possible due to the fact
that oil dampens the capillary waves present on a sea surface,
such that the surface becomes smoother and acts more like a
mirror, i.e. more energy will be reflected away from the radar
by an oil covered surface than by pure water.
In practice however, this task, and in particular the detection
of small oil spills, is further complicated by the noise and
other problems inherent in the nature of radar measurements.
Figure 1: Backscattered energy from water- and
oil-surfaces
1WWW: http://www.his.se/ida/~crg/ or http://www.his.se/ida/~tom/
2.2Doppler radar
The SLAR mentioned above is a Doppler radar, i.e. it detects objects by virtue of their velocity with respect to the radar itself. Doppler filtering makes use of the progressive phase shift (Doppler shift) of an object's return signal on successively transmitted pulses, which is caused by the object's motion towards or away from the radar. The radar echo from a target area consists of the returns of a multitude of point scatterers (with possibly different radial veloc-ities), forming a spectrum of individual phase shifts, the so-called Doppler spectrum or Doppler signature. Hence, beside the mean radial velocity, depending on the waves' translational motion (which can be assumed to be the same for oil and water), the spectral shape and width to some degree reflect the 'internal dynamics' of an illumi-nated area/object. The ability to perform a, to some extent, automatic object classification using a conventional Doppler radar could be considered a significant increase in the capabilities of the radar sensor (Martinez Madrid et al., 1992).
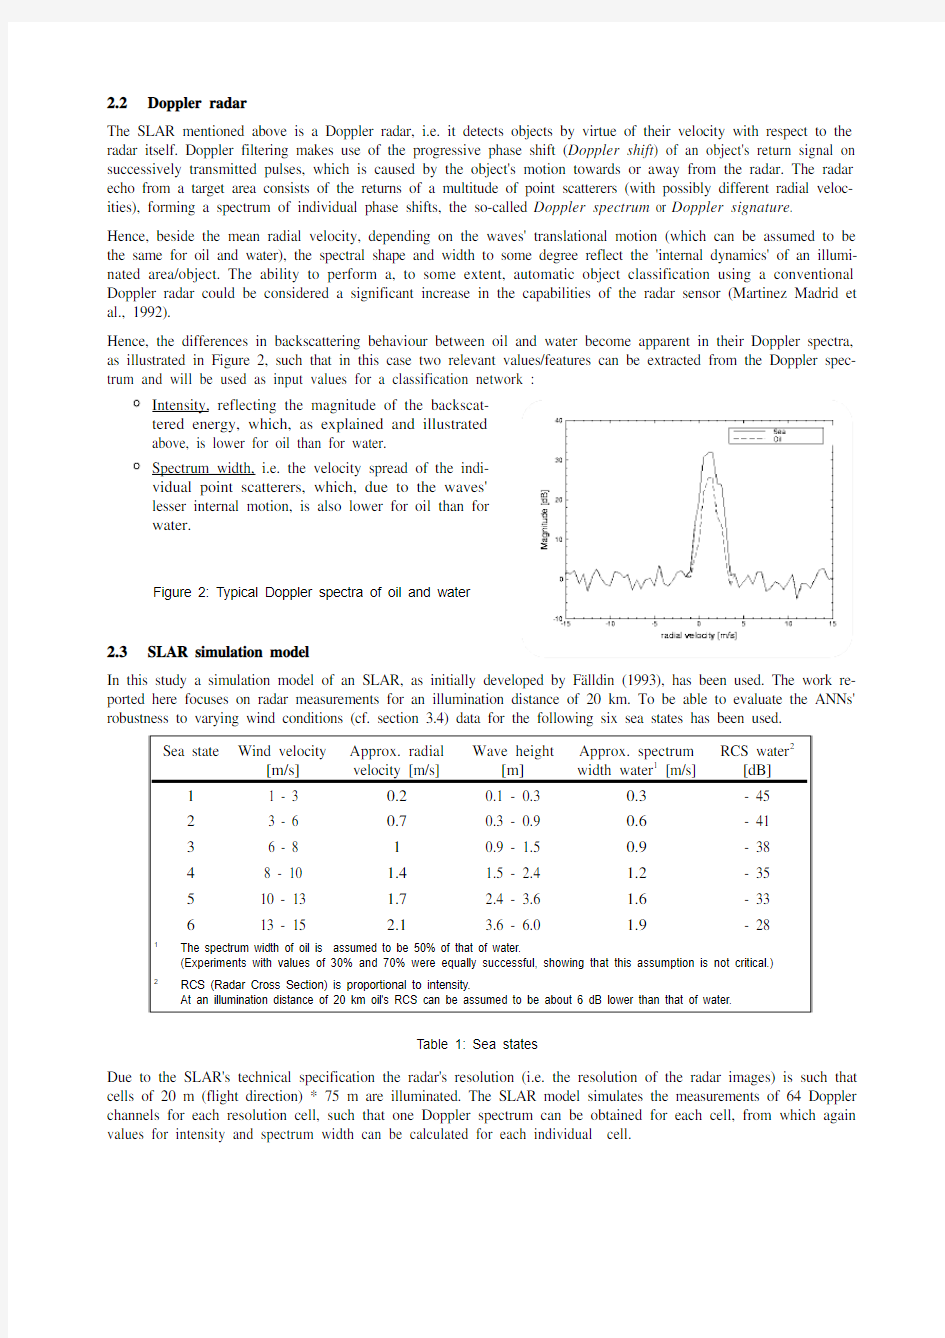
Hence, the differences in backscattering behaviour between oil and water become apparent in their Doppler spectra, as illustrated in Figure 2, such that in this case two relevant values/features can be extracted from the Doppler spec-trum and will be used as input values for a classification network :
Intensity, reflecting the magnitude of the backscat-
tered energy, which, as explained and illustrated
above, is lower for oil than for water.
Spectrum width, i.e. the velocity spread of the indi-
vidual point scatterers, which, due to the waves'
lesser internal motion, is also lower for oil than for
water.
Figure 2: Typical Doppler spectra of oil and water
2.3SLAR simulation model
In this study a simulation model of an SLAR, as initially developed by F?lldin (1993), has been used. The work re-ported here focuses on radar measurements for an illumination distance of 20 km. To be able to evaluate the ANNs' robustness to varying wind conditions (cf. section 3.4) data for the following six sea states has been used.
Table 1: Sea states
Due to the SLAR's technical specification the radar's resolution (i.e. the resolution of the radar images) is such that cells of 20 m (flight direction) * 75 m are illuminated. The SLAR model simulates the measurements of 64 Doppler channels for each resolution cell, such that one Doppler spectrum can be obtained for each cell, from which again values for intensity and spectrum width can be calculated for each individual cell.
2.4Detection of small oil spills - The real problem
two large and five small oil spills (dark areas).
Figure 3: Environment A
show peaks of low values (dark areas) where the large oil spills have their greatest widths (in flight direction), but the small oil spills cannot be discriminated reliably from the noise.
Figure 4: Measurements of a) Intensity and b) Spectrum width in Environment A (sea state 3)
These values have been normalised as relative deviations from reference values (mean values calculated from an area known to be water, in this case the 100 cells in rows 1 to 5) as follows:2
intensity deviation = 10 ^ ( (measured intensity - reference intensity) / 10 ) - 1
spectrum width deviation = (measured spectrum width - reference spectrum width) / ref. spectrum width such that the resulting input vectors together with their (correct) binary classification (using a threshold of 0.5, i.e.50% oil in a resolution cell) look as shown in Figure 5.Hence, the resolution cell vectors show the expected distribution:
The water cells cluster around the (water) reference values, i.e. around point (0,0).The oil cells mostly have both lower intensity and spectrum width values.
But there is a large 'overlap area', that contains both kinds of cells, such that oil and water vectors are defi-nitely not linearly separable. This area mostly con-tains the vectors of the small oil spill cells, such that a reliable classification of an individual cell only on basis of its own values is not possible .
Figure 5: Normalised resolution cell vectors
and their binary classification (environment A)
2
NB: dB is a logarithmic measure, therefore the above normalisation formula for the intensity deviation
So, what makes the detection of small oil spills so difficult? Apart from the fact that radar measurements, by their nature, are noisy, the task is further complicated by the fact that the radar cannot focus on a single resolution cell.That means that at every time step the radar echo does not consist only of the returns of one resolution cell, but those from a much larger area 3. The practically relevant area should be approximately that within the 6 dB beam width 4 of 88m, the SLAR model however simulates measurements up to the 24 dB beam width of 349m.This means that the measurements of a particular cell are always influenced by the returns of a number of neighbour cells. Therefore the radar echo of a single resolution cell containing oil (itself only being 20m * 75 m in size) will actually only be a 'pure oil' echo if the whole area covered by the relevant radar beam contains oil. This has the ef-fect that at the border of oil spills the echoes of oil and water are mixed up, and small oil spills (only consisting of 'borders') can 'get lost' in their water neighbourhood.
Figure 6: Beam width vs. cell size
2.5Goals
The goal here is to develop ANNs capable of classifying individual resolution cells into those containing oil and those containing water, such that the combination of these individual values results in a black-on-white map of oil spills within the illuminated sea environment.Hence, the main requirements are as follows:
The detection should be reliable, i.e. it should be sensitive to oil spills as small as possible.
The network should not generate false alarms, i.e. it should be insensitive to noise in the radar measurements.
The detection should be robust, e.g. to varying sea states/wind conditions.2.6
General approach - earlier work
It has been pointed out earlier that the classification of individual resolution cells cannot be performed reliably (with regard to the detection of small oil spills) only on basis of a single cell's own values. Earlier work by Ziemke & Athley (1995a , 1995b) presented ANNs, capable of classify-ing environments in one particular sea state (1995a) with a
sufficient accuracy, even when varying wind directions (1995b).For the classification of one cell these networks take as input va-lues intensity and spectrum width for the cell itself (C) and its four direct neighbours (N), as shown in Figure 7.Figure 7: Using neighbourhood context information
However, earlier no experiments were carried out with oil spills of less than 80m * 80m, which, as discussed earlier, are the most problematic cases. Moreover the problem of varying sea states (apart from varying wind direc-tions) has not been tackled earlier. This paper discusses these two problems in particular.
3Experiments
Two sets of experiments have been carried out to evaluate a) the detection reliability and sensitivity of three differ-ent ANN architectures (section 3.3) and b) the robustness of these models with regard to varying sea states (section 3.4).The environments and architectures used in these experiments are discussed in sections 3.1 and 3.2.
3
Actually this area is theoretically infinitely large. The SLAR model simulates returns up to the 24 dB beam width, being measured where the gain has fallen 24 dB below maximum. At a distance of 20 km the 24 dB beam width is 349 m.4
The 6 dB beam, being measured where the gain has fallen 6 dB below maximum, is 88m at 20 km distance.
3.1Model environment(s)
should be detected relatively easily.
Figure 8: Environment B
The measurements of intensity and spectrum width within this environment (in sea state 3) are shown below:
Figure 9: Measurements of a) Intensity and b) Spectrum width within environment B
Similar observations can be made here as for the corresponding maps for environment: the larger oil spills appear relatively clearly (at least in the intensity map) whereas the smaller ones (seem to) disappear in the background noise.
left area.
Figure 10: Normalised resolution cell vectors
and their binary classification (environment B)
3.2Architectures
As discussed earlier, all of the networks discussed here have been trained to classify each resolution cell within an environment individually. The target output values have been taken from the oil spill maps as shown in Figures 3and 8, therefore all networks use one output unit. Moreover all networks use as input values the normalised inten-sity and spectrum width values of the cell to be classified and its four direct neighbours (cf. Figure 7), as shown in the intensity and spectrum width maps in Figures 4 and 9, i.e. all networks have ten input units.
In detail, for the experiments discussed here ANNs of the following three architectures have been used, all of them being trained with the same ('fast') backpropagation algorithm using a momentum term and an adaptive learning rate, all of them using the logistic activation function for hidden and output units.
three-layer feed-forward (FF) networks using seven hidden units; experiments have been carried out with more and less hidden units, but did not result in measurably better performance;
recurrent networks similar to those proposed by Jordan5 (1986), with weighted feedback from the output to the hidden layer, hereafter referred to as Recurrent Architecture (RA) I :
Figure 11: Recurrent Architecture (RA) I
recurrent networks similar to the Simple Recurrent Network(s) (SRN) proposed by Elman6 (1990), with
weighted, fully-connected feedback from the hidden layer to itself, hereafter referred to as Recurrent
Architecture (RA) II :
Figure 12: Recurrent Architecture (RA) II
As for the feed-forward networks, initial experiments with different hidden layer sizes were carried out for both RA I and RA II, but did not deliver substantially better results as the ones documented in the next sections.
Both RA I and RA II networks have been trained to classify sequences of resolution cells (including their direct neighbours) individually. So the general approach here is to make use of the context of the previous cell's classifica-tion, which is based on the fact that, as illustrated in Figure 6, it is not possible to measure a clear water echo in one time step and a clear oil echo in the next time step. Instead the transition at the border from water to oil there will normally be a sequence of 4-5 time steps during which oil's 'share' of the returns grows from 0% to 100%. Corre-spondingly, there will be a similar sequence of time steps at the border from oil back to water.
So, both recurrent architectures aim at capturing the information contained in the temporal sequence of changes over a few time steps, from water to oil echo and the other way round, and at exploiting this sequential informa-tion contained in this transition for the classification task.
3.3Reliability & sensitivity
To evaluate the different architectures' performance on detecting small oil spills for one particular sea state, 14 net-works of each architecture have been trained on one half of environment B, 7 of them with the left half, the other 7 with the right half as training set. The experiments described here were carried out for one particular sea state (3), but similar results were obtained when using other sea states. All networks have been trained to a point where in in-itial experiments they achieved best performance when tested on the whole environment. For FF networks that was 500 epochs, for both RA I and RA II 1000 epochs.
5In addition to the architecture used here, Jordan's networks contained a weighted feed-back link from the context-unit(s) (or 'state units', as Jordan originally called them) to itself (themselves).
6Elman trained his SRNs t o predict the next element in a sequence presented to the network, therefore input and output layer were of the same size.
The performance of the 10 best networks of each class when tested on all of environments A and B is summarised in the following table. The results clearly show that, although being trained on environment B, all networks show better performance in environment A. RA II networks show slightly better performance than those of RA I, the FF networks' performance is significantly worse.
Table 2: Performance of ANNs trained on half of environment B, tested on the whole environment.
(sea state 3 only)
To further illustrate the above results, the best (continuous) output maps for each architecture are shown below:
As expected these maps show that it is the smallest oil spills which cannot be detected. Nevertheless, using RA II, the oil spill detection works rather reliably down to a size of about 50m*50m. Regarding the relatively low resol-ution of the radar used here this result can be considered fully satisfactory.
3.4Robustness (to varying sea states)
To evaluate the ANNs' robustness to variations in sea states/wind conditions, five networks of each architecture have been trained in the same way as described above, but this time on both the left halves of environments A and B, both in sea state 3. These networks have been tested on the whole of both environments in all sea states. It has however turned out that the results obtained for sea state 1 were dramatically worse than those for other sea states. This can be explained by the fact that for very low waves (as in sea state 1) the rather small differences between oil and water can easily 'disappear' in the noise. Therefore the results for sea state 1 have been omitted here, the results for the remaining 5 sea states (2-6) are shown below. It also turned out that more than 50% of the false alarms oc-curred in sea state 2, therefore they are especially marked in the following table.
Table 3: Performance ANNs trained on 50% of environments A and B (sea state 3),
tested on all of both environments in sea states 2 - 6
It can be seen that, although the networks have only been trained for one particular sea state, the classification per-formance across five sea states (2-6) is not much worse than that earlier for sea state 3 alone. Again, the RA II net-works exhibits the clearly best performance. The following figure shows the continuous output values computed by one of these networks as well as the resulting binary classification (using a threshold of 0.5).
When comparing these maps to the correct environment map (originally shown in Figure 3) it can be seen that the output as generated by an RA II network actually comes very close to the original.
Figure 14: a) Continuous output map from an RA II network, b) resulting binary classification and
c) original environment (for comparison)
4 Conclusion
Three different ANN architectures for the detection of oil spills from radar imagery have been presented in this paper. An evaluation of their performance regarding the reliability/sensitivity of the detection of small oil spills as well as the robustness to varying sea states/wind conditions shows that significantly better performance is exhibited by the recurrent architectures. In particular, best performance is achieved by RA II networks, which are architec-turally similar to Elman's (1990) SRNs.
It has been shown that networks of this recurrent architecture have been successfully trained such that
a high detection reliability and sensitivity even to small oil spills (down to a size of about 50m * 50m)
has been achieved;
the number of false alarms could be kept to a minimum, i.e. a low sensitivity to noise has been achieved;
the networks are very robust to variations in wind conditions for the sea states from 3 to 6 (and, with some limitations, 2).
Hence, the results reported here can be considered very satisfactory. The approach taken here, of having an ANN compute a rather clear output image on the basis of two noisy input images, is a rather general one as it might be applicable to a number of similar problems.
References
Elman, Jeffrey L. (1990) Finding Structure in Time, Cognitive Science, 14, pp. 179 - 211
F?lldin, Bj?rn (1993) SLAR, Side Looking Airborne Radar - Signal Processing, Design and Evaluation, Master's Thesis, Chalmers Technical University, Gothenburg, Sweden
Jordan, Michael I. (1986) Attractor dynamics and parallelism in a connectionist sequential machine, in: Proceed-ings of the Eight Conference of the Cognitive Science Society, pp. 531-546
Martinez Madrid, Juan J., Casar Corredera, Jose R. & de Miguel Vela, G. (1992) A Neural Network approach to Doppler-based target classification, in: Proceedings of the IEEE International Radar Conference 'RADAR 92', pp. 450-453
Ziemke, Tom & Athley, Fredrik (1995a) Connectionist Models for the Detection of Oil Spills from Doppler Radar Imagery, in: Niklasson, Lars F. & Bodén, Mikael B. (eds.) Current Trends in Connectionism, Lawrence Erlbaum Associates, pp. 355-370, also available as Technical Report No. HS-IDA-TR-95-002, University of Sk?vde, Dept.
of Computer Science
Ziemke, Tom & Athley, Fredrik (1995b) Oil Spill Detection from Doppler Radar Imagery using Artificial Neural Networks, in: Proceedings of the International Conference on Engineering Applications of Neural Networks (EANN '95), Helsinki/Finland, pp. 83-86, also available as Technical Report No. HS-IDA-TR-95-007, University of Sk?vde, Dept. of Computer Science
一、对等网简介 “对等网”也称“工作组网”,那是因为它不像企业专业网络中那样是通过域来控制的,在对等网中没有“域”,只有“工作组”,这一点要首先清楚。正因如此,我们在后面的具体网络配置中,就没有域的配置,而需配置工作组。很显然,“工作组”的概念远没有“域”那么广,所以对等网所能随的用户数也是非常有限的。在对等网络中,计算机的数量通常不会超过20台,所以对等网络相对比较简单。在对等网络中,对等网上各台计算机的有相同的功能,无主从之分,网上任意节点计算机既可以作为网络服务器,为其它计算机提供资源;也可以作为工作站,以分享其它服务器的资源;任一台计算机均可同时兼作服务器和工作站,也可只作其中之一。同时,对等网除了共享文件之外,还可以共享打印机,对等网上的打印机可被网络上的任一节点使用,如同使用本地打印机一样方便。因为对等网不需要专门的服务器来做网络支持,也不需要其他组件来提高网络的性能,因而对等网络的价格相对要便宜很多。 对等网主要有如下特点: (1)网络用户较少,一般在20台计算机以内,适合人员少,应用网络较多的中小企业; (2)网络用户都处于同一区域中; (3)对于网络来说,网络安全不是最重要的问题。 它的主要优点有:网络成本低、网络配置和维护简单。 它的缺点也相当明显的,主要有:网络性能较低、数据保密性差、文件管理分散、计算机资源占用大。 二、对等网结构 虽然对等网结构比较简单,但根据具体的应用环境和需求,对等网也因其规模和传输介质类型的不同,其实现的方式也有多种,下面分别介绍: 1、两台机的对等网 这种对等网的组建方式比较多,在传输介质方面既可以采用双绞线,也可以使用同轴电缆,还可采用串、并行电缆。所需网络设备只需相应的网线或电缆和网卡,如果采用串、并行电缆还可省去网卡的投资,直接用串、并行电缆连接两台机即可,显然这是一种最廉价的对等网组建方式。这种方式中的“串/并行电缆”俗称“零调制解调器”,所以这种方式也称为“远程通信”领域。但这种采用串、并行电缆连接的网络的传输速率非常低,并且串、并行电缆制作比较麻烦,在网卡如此便宜的今天这种对等网连接方式比较少用。 2、三台机的对等网
物联网技术与应用 对等网络配置及网络资源共享 实验报告 组员:
1.实验目的 (1)了解对等网络基本配置中包含的协议,服务和基本参数 (2)了解所在系统网络组件的安装和卸载方法 (3)学习所在系统共享目录的设置和使用方法 (4)学习安装远程打印机的方法 2.实验环境 Window8,局域网 3.实验内容 (1)查看所在机器的主机名称和网络参数,了解网络基本配置中包含的协议,服务和基本参数 (2)网络组件的安装和卸载方法 (3)设置和停止共享目录 (4)安装网络打印机 4.实验步骤 首先建立局域网络,使网络内有两台电脑 (1)“我的电脑”→“属性”,查看主机名,得知两台计算机主机名为“idea-pc”和“迦尴专属”。 打开运行输入cmd,进入窗口输入ipconfig得到相关网络参数。局域网使用的是无线局域网。 (2)网络组件的安装和卸载方法:“网络和共享中心”→“本地连接”→“属
性”即可看到网络组件,可看其描述或卸载。 “控制面板”→“卸载程序”→“启用和关闭windows功能”,找到internet 信息服务,即可启用或关闭网络功能。 (3)设置和停止共享目录(由于windows版本升高,加强了安全措施和各种权
限,所以操作增加很多) 使用电脑“idea-pc”。“打开网络和共享中心”→“更改高级选项设置”。将专用网络,来宾或公用,所有网络中均选择启用文件夹共享选项,最下面的密码保护项选择关闭,以方便实验。 分享文件夹“第一小组实验八”,“右键文件夹属性”→“共享”→“共享”,选择四个中的一个并添加,此处选择everyone,即所有局域网内人均可以共享。
对等网络(P2P 一、概述 (一定义 对等网络(P2P网络是分布式系统和计算机网络相结合的产物,在应用领域和学术界获得了广泛的重视和成功,被称为“改变Internet的新一代网络技术”。 对等网络(P2P:Peer to Peer。peer指网络结点在: 1行为上是自由的—任意加入、退出,不受其它结点限制,匿名; 2功能上是平等的—不管实际能力的差异; 3连接上是互联的—直接/间接,任两结点可建立逻辑链接,对应物理网上的一条IP路径。 (二P2P网络的优势 1、充分利用网络带宽 P2P不通过服务器进行信息交换,无服务器瓶颈,无单点失效,充分利用网络带宽,如BT下载多个文件,可接近实际最大带宽,HTTP及FTP很少有这样的效果 2、提高网络工作效率 结构化P2P有严格拓扑结构,基于DHT,将网络结点、数据对象高效均匀地映射到覆盖网中,路由效率高 3、开发了每个网络结点的潜力 结点资源是指计算能力及存储容量,个人计算机并非永久联网,是临时性的动态结点,称为“网络边缘结点”。P2P使内容“位于中心”转变为“位于边缘”,计算模式由“服务器集中计算”转变为“分布式协同计算”。
4、具有高可扩展性(scalability 当网络结点总数增加时,可进行可扩展性衡量。P2P网络中,结点间分摊通信开销,无需增加设备,路由跳数增量小。 5、良好的容错性 主要体现在:冗余方法、周期性检测、结点自适应状态维护。 二、第一代混合式P2P网络 (一主要代表 混合式P2P网络,它是C/S和P2P两种模式的混合;有两个主要代表: 1、Napster——P2P网络的先驱 2、BitTorrent——分片优化的新一代混合式P2P网络 (二第一代P2P网络的特点 1、拓扑结构 1混合式(C/S+P2P 2星型拓扑结构,以服务器为核心 2、查询与路由 1用户向服务器发出查询请求,服务器返回文件索引 2用户根据索引与其它用户进行数据传输 3路由跳数为O(1,即常数跳 3、容错性:取决于服务器的故障概率(实际网络中,由于成本原因,可用性较低。
对等网络的网络弹性分析 摘要:网络弹性研究的是网络在节点失效或被有意攻击下所表现出来的特征。分析Gnutella网络的网络弹性,包括对于随机攻击的容错性和对于选择性攻击的抗攻击性,并与ER模型和EBA模型进行了对比。Gnutella网络对于随机攻击具有很好的容错性,但是对于选择性攻击却显得脆弱。最后对网络弹性进行了理论分析,给出了网络在出现最大集团临界点之前的平均集团大小的公式解。 关键词:对等网络;无标度;网络弹性;脆弱性 中图分类号:TP393.02文献标识码:A 文章编号:1001-9081(2007)04-0784-04 0 引言 在过去的40多年里,科学家习惯于将所有复杂网络看作是随机网络。随机网络中绝大部分节点的连结数目会大致相同。1998年开展的一个描绘互联网的项目却揭示了令人惊诧的事实:基本上,互联网是由少数高连结性的页面串联起来的,80%以上页面的连结数不到4个,而只占节点总数不到万分之一的极少数节点,例如门户网Yahoo和搜索引擎Google等类似网站,却高达上百万乃至几十亿个链接。研究者把包含这种重要集散节点的网络称为无标度网络[1]。
具有集散节点和集群结构的无标度网络,对意外故障具有极强的承受能力,但面对蓄意的攻击和破坏却不堪一击[2]。在随机网络中,如果大部分节点发生瘫痪,将不可避免地导致网络的分裂。无标度网络的模拟结果则展现了全然不同的情况,随意选择高达80%的节点使之失效,剩余的网络还可能组成一个完整的集群并保持任意两点间的连接,但是只要5%―10%的集散节点同时失效,就可导致互联网溃散成孤立无援的小群路由器。 许多复杂网络系统显示出惊人的容错特性,例如复杂通信网络也常常显示出很强的健壮性,一些关键单元的局部失效很少会导致全局信息传送的损失。但并不是所有的网络都具有这样的容错特性,只有那些异构连接的网络,即无标度网络才有这种特性,这样的网络包括WWW、因特网、社会网络等。虽然无标度网络具有很强的容错性,但是对于那些有意攻击,无标度网络却非常脆弱。容错性和抗攻击性是通信网络的基本属性,可以用这两种属性来概括网络弹性。 对等网络技术和复杂网络理论的进展促使对现有对等 网络的拓扑结构进行深入分析。对网络弹性的认识可以使从网络拓扑的角度了解网络的脆弱点,以及如何设计有效的策略保护、减小攻击带来的危害。本文研究Gnutella网络的网络弹性,并与ER模型和EBA模型进行了比较,对比不同类 型的复杂网络在攻击中的网络弹性。当网络受到攻击达到某
实验一建立对等网 一、实验目的 (1)熟悉10BASE-T星型拓扑以太网的网卡、线缆、连接器等网络硬件设备; (2)熟悉WINDOWS中的网络组件及各参数的设置; (3)理解对等网络的特点。 二、实验环境 此实验的基本要求就是两台以上计算机作为一个工作组,连接到一台服务器上,建立一个基于Windows的对等网络,物理结构为10BASE-T以太网。各工作组中的用户可以共享资源。 三、实验内容 (1)网络布线 EIA/TIA的布线标准中规定了两种双绞线的线序568A与568B,分别为: T568A:白绿 | 绿 | 白橙 | 蓝 | 白蓝 | 橙 | 白棕 | 棕 T568B:白橙 | 橙 | 白绿 | 蓝 | 白蓝 | 绿 | 白棕 | 棕 在整个网络布线中应用一种布线方式,但两端都有RJ45端头的网络连线无论就是采用端接方式A,还就是端接方式B,在网络中都就是通用的。实际应用中,大多数都使用T568B的标准,通常认为该标准对电磁干扰的屏蔽更好,本次实习中即采用了端接方式B。 (2)连接网线,建立对等网 连接网线的方式与网卡接口与网络结构有关,本局域网中采用的就是星型结构。以集线器(HUB)为中央结点,网络中所有计算机都通过双绞线连接至集线器,通过集线器交换信息。星型结构的优点就是利用中央结点可方便地提供服务与重新配置网络,单个连接点的故障只影响一个设备;缺点就是每个站点直接与中央结点相连,需要大量电缆,费用较高。 连接好网络线后接通计算机电源,观察网卡后面板上的两只LED工作状态指示灯。绿灯亮表示网络线接通,红灯间接闪烁说明网卡工作正常。 (3)MS-DOS方式中,执行ping命令进行测试
实验:Windows下对等网络的实现 实验目的 了解虚拟机中网络适配器的配置。 了解对等网络的基本概念与结构。 学习对等网络组件在系统中的安装与设置方法。 掌握利用对等网络进行数据传输与文件共享的方法。 实验任务 为虚拟机中的Windows系统安装网络组建。 配置虚拟机的IP地址设置、协议与服务绑定等网络参数,使之能从主机上访问虚拟机。 在虚拟机上设立共享目录、共享文件、设立权限等; 从主机映射虚拟机上的共享目录。 预备知识 虚拟机的原理和vmware虚拟机软件的使用 Windows操作系统基本操作 计算机网络原理与TCP/IP协议 实验平台与工具 PC机+Windows XP SP2 Vmware5.5+Windows2003 server 实验用时 120分钟 基础知识 VMware的几种网络模式 1.bridged(桥接模式) :等于让Guest和Host系统并列在同一个子网中,占用两个ip,相互独立(对 于绑定网卡的子网络就不适用了,而且Guest的包就直接出去了,Host管不了)。等效网络结构 如下:
2.host-only(主机模式) :对应Host里面的"VMnet1",Guest的ip由VMware的DHCP提供,相当 于与Host网线直连如果要访问外网,还需要手工做网桥。其等效网络结构图如下: 3.NA T (网络地址转换模式) :这个对于让Guest OS访问Internet是最简单的,对应"VMnet8",直 接使用Guest认的网卡就行了,ip是VMware的DHCP对应VMnet8分配的,与外网无关,但 Guest对外的访问,会自动转换出去。其等效网络结构图如下: 实验步骤 第一部分:准备运行环境
第19卷第5期湖 北 工 学 院 学 报2004年10月 Vol.19No.5 Journal of Hubei Polytechnic University Oct.2004 [收稿日期]2004-05-25 [作者简介]詹春华(1971-),男,湖北红安人,华中科技大学硕士研究生,研究方向:计算机网络,分布式计算. [文章编号]1003-4684(2004)10 0034 03 对等网络搜索方法比较与分析 詹春华,陈晓苏 (华中科技大学计算机学院,湖北武汉430074) [摘 要]详细介绍了现存的P2P 网络中的搜索技术,对搜索方法进行了比较和分析,指出了它们的优缺点.[关键词]对等网络;分布式搜索;搜索[中图分类号]T P 393 [文献标识码]:A 对等网络(peer to peer,P2P)技术是近年来计算机网络技术中的一个热点.P2P 可简单地定义为对等点(peer)之间通过直接交换信息从而达到共享计算机资源和服务,每一个对等点可以同时充当客户端和服务器两种角色,以该技术构建的网络称为对等网.对等网络是一个完全分布式的网络,所有对等点都是自治的,没有统一的管理,它们共同组成一个系统.对等网络在容错性、资源共享的可扩展性、自我组织、负载平衡、匿名等方面具有很大的优势.目前P2P 技术被广泛应用于文件共享、协同工作、分布式计算等领域. 对等网络中的一个基本问题就是如何找到储存有特定数据的节点,即分布式搜索问题.当节点在其自身找不到想要的对象时,就会发出请求,搜索过程涉及请求转发方法、收到请求消息的节点、消息的形式、某些节点维护的局部索引等方面. 不同网络结构可能会采用不同搜索方法.搜索方法对于对等网络系统的性能、网络流量和可扩展性等方面有很大影响. 笔者详细介绍了现存的P2P 网络中的搜索技术,对搜索方法进行了比较和分析,指出了其优缺点. 1 P 2P 系统分类 当前的P2P 系统,可以根据系统是否对拓扑结构和共享信息(文件)存放位置作出规定分为两大类:非结构化系统和高度结构化系统. 非结构化系统对网络拓扑结构的构成没有严格 的限制,节点可以自由地动态加入网络.非结构化系统主要关注的是共享数据,但对每个节点的共享数据的存放位置没有很好的规则,每个节点可以随意地决定其要共享的数据和共享数据的位置.非结构化系统不能保证每个搜索都能成功. 非结构化系统还可根据P2P 网络模型分为两类:纯P2P 系统和混合P2P 系统.在纯P2P 系统中每个节点的地位都是平等的.混合P2P 系统中,某些节点为超级节点,其余节点则为叶节点,超级节点为其相邻的叶节点的文档建立索引,并为相邻的叶节点提供搜索服务.这一类的系统有Napster [1]、Gnutella [2] 、Fr eenet [3] 等. 高度结构化系统对拓扑结构的 叠加"被严格控制,文件(或者文件指针)存放在确定的位置上. 2 非结构化系统的搜索方法 非结构化系统的搜索方法主要有两类:一类为盲目搜索,它不依赖于任何已知信息,简单地将搜索请求传播给足够多的节点.另一类为启发式搜索,节点利用已知的信息进行搜索.已知信息可以是节点根据已有的搜索结果逐步建立的搜索知识库,也可能是准确的目标位置信息.这些信息的位置也有很大变化,在集中式网络结构中,该信息存在于一个所有节点都知道的中央目录,在分布式网络结构中,该信息保存在每个节点自身. 2.1 盲目搜索 2.1.1 基本盲目搜索方法 这种方法基于洪泛法,节点向所有相邻节点转发搜索请求,在搜索请求中
实验小型办公室对等网络的组建 一.实验目的 1.熟悉网卡、掌握如何在Windows下如何察看网卡的型号、MAC地址、IP 地址等参数。 2.熟悉Windows中的网络组建及各参数的设置和基本意义。 3.在对等网中建立共享。 4.网络测试命令PING的用法 二.实验任务与要求 1、网卡是网络中不可缺少的网络设备,掌握其使用情况,及如何设置其参数对网络的正常使用非常重要。本部分要完成以下任务: (1)利用Windows下Ipconfig 命令查看网卡的基本参数。 (2)如何设置网卡的IP地址。 2、Ping是个使用频率极高的实用程序,用于确定本地主机是否能与另一台主机交换(发送与接收)数据报。根据返回的信息,就可以推断TCP/IP参数是否设置得正确以及运行是否正常。 (1)Ping 本机Ip(Ping 本机机器名;Ping 127.0.0.1)。 (2)Ping 邻近计算机的ip(或者是对方计算机的机器名)。 (3)Ping 网站(前题是能接入Internet)。 3、对等网络(Peer to Peer)也称工作组模式,其特点是对等性,即网络中计算机功能相似,地位相同,无专用服务器,每台计算机相对网络中其他的计算机而言,既是服务器又是客户机,相互共享文件资源以及其他网络资源。本次实验要求完成以下任务: (1)如何修改计算机所在工作组、计算机名。 (2)配置网卡并注意观察网络硬件的连接方法。 (3)完成对等网的组建与测试。 三.实验步骤 (1)Ipconfig的使用
(2)利用“网上邻居”修改网络参数。 (3)PING命令的使用(报告中只要求简化过程) ·ping 本机IP
对等网络概念原理及应用 一、对等网络概述 1.1 对等网络的定义 集中式管理与控制模式网络结点在功能上是不平等的,总有一些少数结点在网络中占居中心主导地位,管理其它从属结点可执行的操作,控制它们间的信息交互。其特点是网络管理复杂度小且易于控制,但不足是网络工作效率低、规模扩展性不好且存在单点故障。 分布式管理与控制模式网络结点在功能上是平等的,网络中没有结点比其它结点拥有更大的特权,网络的管理与控制有各个结点间的相互协作来完成的。其特点是网络工作效率高、规模扩展性强,但网络管理复杂度大且不易于控制。 虽着因特网规模的不断扩大与应用功能的不断扩展,目前因特网主流应用模式---客户服务器模式已不能满足用户的实际需求。迫切需要新的应用模式。 对等计算思想本质:打破传统的网络集中管理与控制的客户服务器模式,使网络成员享有自由、平等、互联的权力。 对等网络(Peer-to-Peer network,P2P):分布式系统与计算机网络相结合的产物,是采用对等计算模式工作的计算机网络(应用服务)。每个节点在行为上是自由的,在功能上是平等的,在关系上是互联的。所有节点分布式地自组织成一个整体网络,能够极大地提高网络效率,充分地利用网络带宽,发挥每个网络节点的潜能。 对等计算起源于1956年,但由于当时的网络技术条件的限制与网络应用没有充分地发展起来,一直未引起学术、工业与商业界重视,因此,它的发展十分缓慢。 网络应用实践表明:任何一种思想、理论与技术的流行通常需要一个杀手级的应用(killer application),以一种征服性的力量冲击人们的传统思维。对等网络的杀手锏级的应用则出现在1999年,第一个应用性对等网络Napster,一种音乐下载软件,创造了在半年时间内拥有5000万用户的网络奇迹,向世人展示了对等网络的优异性能和巨大潜力。继Napster之后,又有一系列随着人们耳熟能详的对等网络应用软件,如Gnutella、KaZaA、BitTorrent、eDonkey/eMule、Skype