ISIJ International, Vol. 51 (2011), No. 3, pp. 435–440
435?2011ISIJ
2.2.Application of Sol–Gel Coatings
The cold rolled and annealed (CRCA) steel sheets were used for the present study. These sheets were cleaned to re-move oil and grease and subjected to phosphating in tri-cationic phosphate base solution to obtain a thin coating of ?0.5m m thickness (2–3g/m 2). The synthesized sol–gel so-lution was applied on bare CRCA and phosphated sheet by dipping process for 1min at room temperature, followed by slow drying at the rate of 20°C/m and ?nally kept at 150°C for one 1h
2.3.Measurements
Spectra of sol–gel solution was recorded on fourier trans-form infrared spectrophotometer (Nicolet 5700, Thermo Electron Corporation) in the spectra range of 400–4000cm ?1.
Particle size of sol–gel solution was determined by using the dynamic light scattering (DLS) technique (Malvern Nano-ZS instrument).
An advancing sessile drop method was used for the contact angle measurement. The static contact angle of coated samples were determined by contact angle system OCAH230 (Dataphysics Instrument, Germany). Deminer-alised water (DM) water is used as testing liquid.
Glass transition temperature (T g ) was calculated through Differential Scanning Calorimetry (DSC) study (TA instru-ment, Q10). Approximately 10mg of 7d cured ?lm was taken on hermitic type pans and immediately DSC runs were made at heating rates of 10°C/min between 30–500°C under 50mL/min nitrogen in a dynamic mode of operation.The glass transition temperature was determined from the second heating cycle.
After curing for 7d, powdered sol–gel sample was analysed using a simultaneous TG-DTA analyser (Shi-madzu, DTG-60, Japan) in nitrogen environment with sam-ple weight of about 3mg. Heating rate was maintained at 10°C/min in the temperature range of 30 to 500°C.
The microstructure and surface morphology of the sol–gel coated sample were observed by a scanning elec-tron microscope (SEM, SUPRA 25, ZEISS FEG) equipped with energy-dispersive spectrometer (EDX). The energy used for analysis was 15kV .
The cupping test was done as per the ASTM E643-84.The objective of this test is to identify the resistance of the coated ?lm against ongoing deformation of a coated steel panel. Initial disturbance point (crack) measured in mm is recoded as cupping value.
Corrosion resistance of sample was evaluated by electro-chemical impedance spectroscopy (EIS) and potentiody-namic polarisation techniques. The EIS measurements were carried out using the Gamry EIS 300. A typical three elec-trode was employed in those tests, the samples acted as the working electrode (1cm 2of exposed area), saturated calomel electrode (SCE) as reference and graphite as counter electrode. 3.5% (w/v%) NaCl solution was used as an electrolyte in all the measurement. The EIS measure-ment was carried out in the frequency range of 100kHz to 0.01Hz and the applied voltage was 5mV .
Salt spray tests were carried out by exposing the un-scribed samples (7.5cm ?7.5cm size coated panel with 5–6m m dry ?lm thickness) in a salt spray chamber as per the ASTM B-117 test method. The panels were checked at regular interval of time and results were noted down in terms of blisters, creep and red rust.3.Result and Discussion
3.1.Infra Red Spectroscopy Study
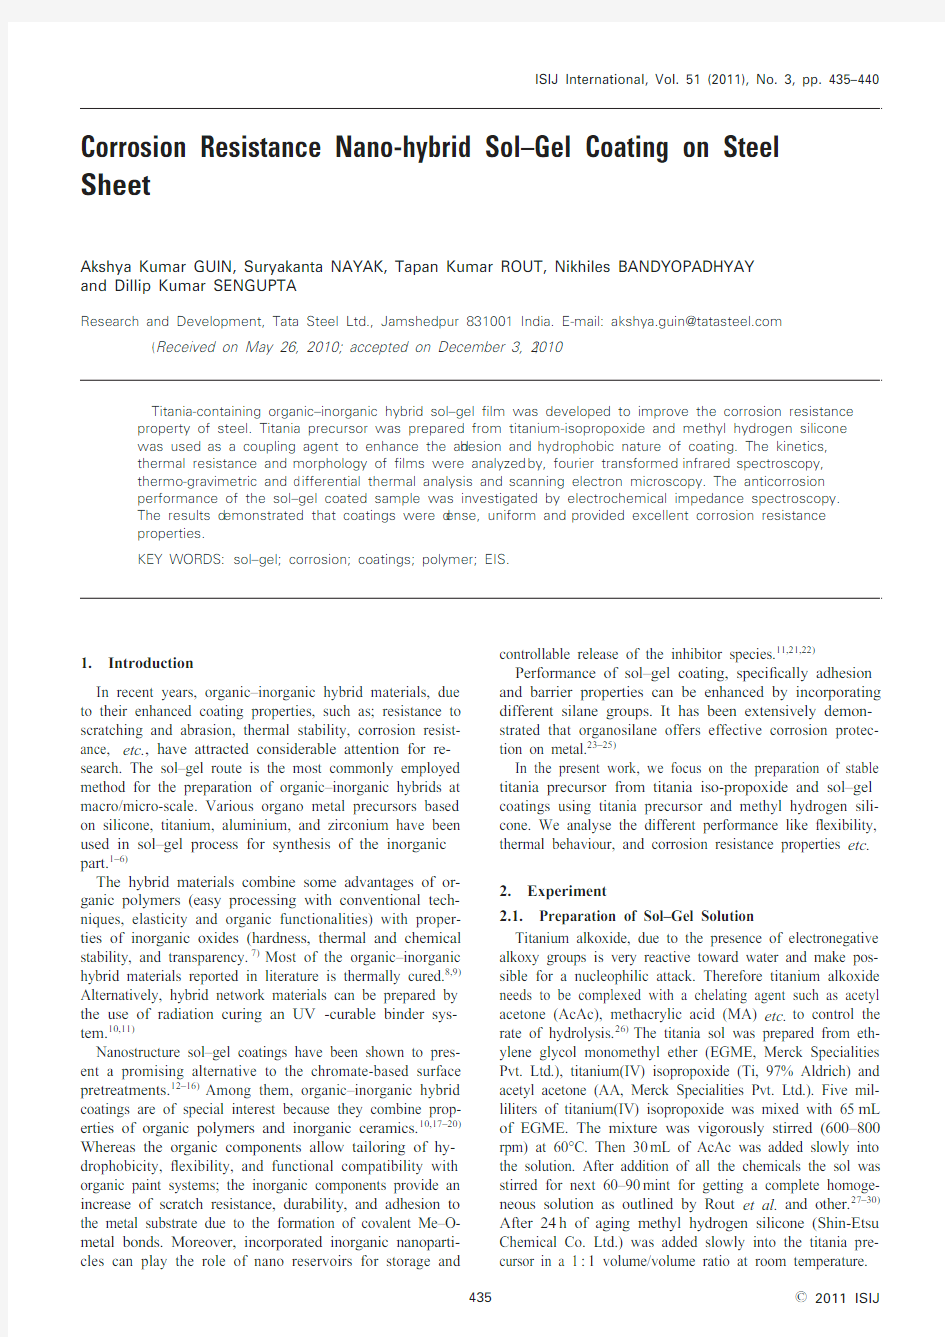
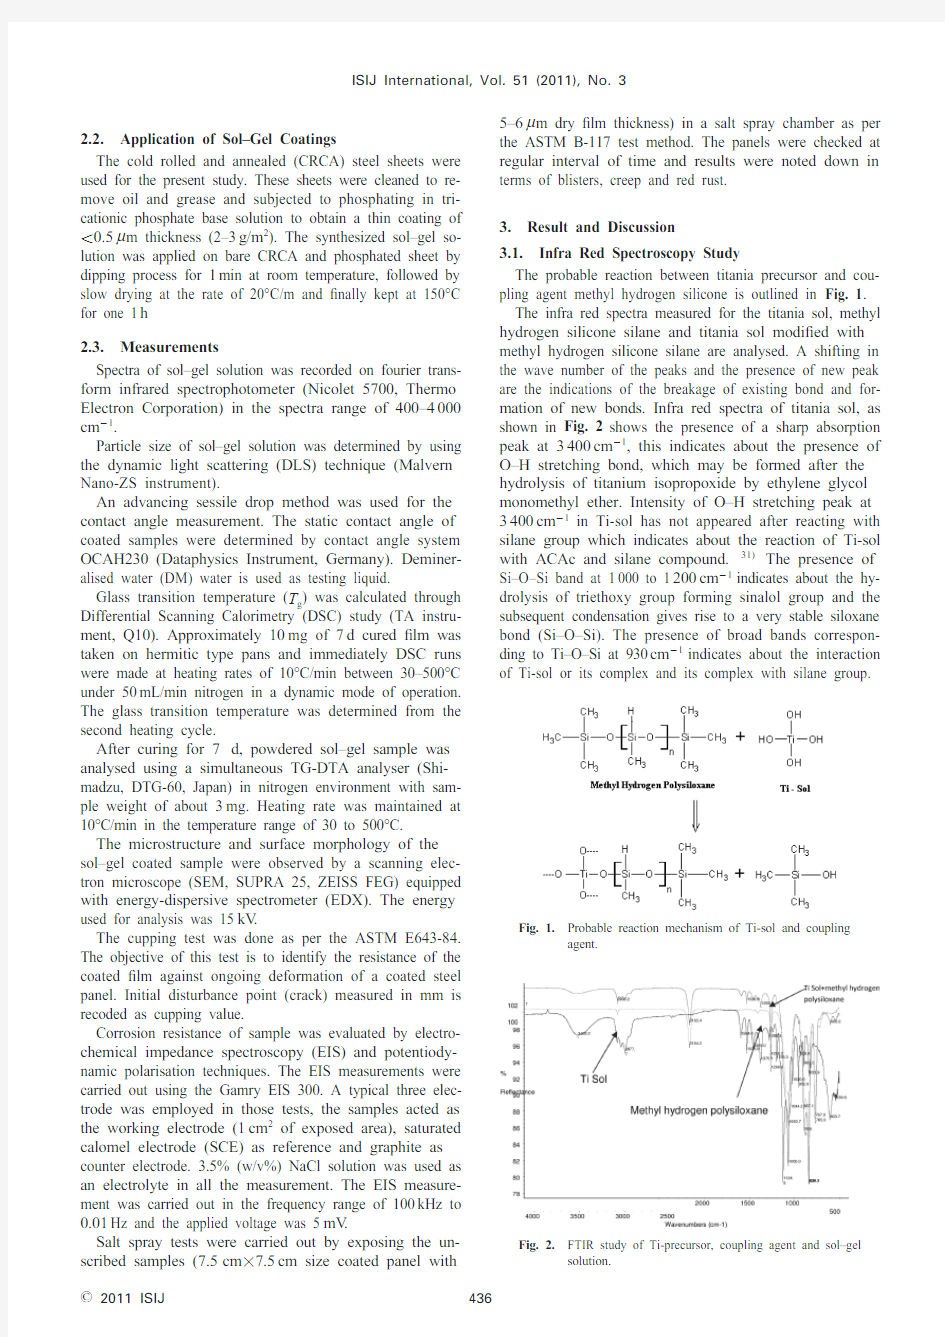
The probable reaction between titania precursor and cou-pling agent methyl hydrogen silicone is outlined in Fig. 1.The infra red spectra measured for the titania sol, methyl hydrogen silicone silane and titania sol modi?ed with methyl hydrogen silicone silane are analysed. A shifting in the wave number of the peaks and the presence of new peak are the indications of the breakage of existing bond and for-mation of new bonds. Infra red spectra of titania sol, as shown in Fig. 2shows the presence of a sharp absorption peak at 3400cm ?1, this indicates about the presence of O–H stretching bond, which may be formed after the hydrolysis of titanium isopropoxide by ethylene glycol monomethyl ether. Intensity of O–H stretching peak at 3400cm ?1in Ti-sol has not appeared after reacting with silane group which indicates about the reaction of Ti-sol with ACAc and silane compound.31)The presence of Si–O–Si band at 1000 to 1200cm ?1indicates about the hy-drolysis of triethoxy group forming sinalol group and the subsequent condensation gives rise to a very stable siloxane bond (Si–O–Si). The presence of broad bands correspon-ding to Ti–O–Si at 930cm ?1indicates about the interaction of Ti-sol or its complex and its complex with silane group.
436
?2011
ISIJ
Fig.1.Probable reaction mechanism of Ti-sol and coupling
agent.
Fig.2.FTIR study of Ti-precursor, coupling agent and sol–gel
solution.
3.2.Particle Size Analysis
The formulated sol gel solution is kept for 30d to ob-serve any precipitation or gelling, but no gelling has been noticed even after 30d of aging. Particle size distribution of 30d aged sol–gel solution has been measured. It is found that particle size is in the range of 2–5nm as shown in Fig.3. This close size range is due to the controlled growth of the particles in the sol during hydrolysis and the condensa-tion reaction of titania precursor in the presence of water and acetyl acetone (AcAc).32)The addition of AcAc might have inhibited both hydrolysis and condensation reaction of titanium precursor.
3.3.Thermal Analysis Study
The TG-DTA curve of the cured sample as shown in Fig.4demonstrates very small weight loss in the temperature range of 150–200°C which are characteristic of the desorp-tion of physically adsorbed water molecules. There is a steady weight loss between 150 and 450°C and one exothermic peak is observed at 360°C, (Fig. 4), which can be attributed to the release of chemically bounded water (around 200°C) and the decomposition of the organic com-ponents (around 300°C). DTA curve demonstrates an exothermic peak near 400°C, which can be associated with the crystallization process of an amorphous oxide.33)
After 700°C only 27.80% weight loss has observed which implies about rigid and integrated polymer network formed by titania and coupling agents. One of the impor-tant observations from TGA-DTA analysis is the slow and gradual degradation of polymer hybrid and there is no sud-
den decomposition of coating which could provide crack free surface to the applied coating even at higher tempera-ture. This is not the case in general organic paints and coat-ings.
The glass transition temperature determined from the second heating cycle is found to be 72.61°C. This high glass transition temperature of cured coating, as shown in Fig. 5indicates about high rigidity and integral cross link-ing network formed by titania and silane group. This inte-gral cross linking network may create an environment for moisture and other aggressive anions which can not easily penetrate through coating and subsequently enhance the corrosion resistance of coated metal surface.
3.4.Contact Angle Measurement
The evaluation of the wetting properties, estimation of free surface energy, and hydrophobicity of the non coated and coated sample have been assessed by contact angle measurement. By applying following concept we can meas-ured the surface energy of coated sample from the calcu-lated contact angle.
The calculation of solid surface tension, g sv , from the contact angle, q , of a liquid of surface tension g Lv state with Y oung’s equation
g SL ?g sv ?g Lv cos q (1)
Where g SL is the solid liquid interfacial tension.
On the other hand, contact angle data clearly support the Equation of state (EOS) approach; where by the solid liquid interfacial tension is thought to be a function only of the total solid and liquid surface tension irrespective of the types and relative magnitudes of the intermolecular forces present within each phase.
g SL ?f (g Lv ,g sv ) (2)
If the commonly used assumption of negligible liquid vapor adsorption is applied, then Eqs. (1) and (2) may be written in term of g L and g S
An old equation of state for solid–liquid interfacial ten-sion is that
g SL ?g S ?g L ?2(g S g L )1/2 (3)
Combining Eqs. (1) and (3) gives
g S ?1/4g L (1?cos q )2
437?2011
ISIJ
Fig.3.
Particle size distribution curve of sol-gel solution.
Fig.4.
TGA-DTA analysis of coated sample.
Fig.5.Measurement of glass transition temperature (T g ) by
DSC.
Contact angle of the coatings on phosphated sheet is found to be 100.96°and corresponding surface free energy measured by EOS method is found to be 22.45mN/m (Table 1). Similarly contact angle of coating applied on CRCA sheet is found to be 98.9°and corresponding free surface energy is 23.73, which means, both the coated sam-ples (phosphated and CRCA) impart hydrophobicity on the metal surface. As the water molecules do not retain on the surface due to this hydrophobicity, corrosion is also inhib-ited on coated metal surfaces.
3.5.Coating Morphology Study
The surface composition and morphology of the coating was determined with SEM/EDX using a Leo Scanning Electron Microscope (SEM) with an EDAX EDX-system for chemical analysis. Au was sputtered to suppress charg-ing. The basic coating contains C, O, Si, and Ti along with Fe peaks. Although the EDX spectra don’t supply informa-tion about chemical state of these elements we can expect that Si and Ti are present as oxides and the C is from the or-ganic system. Oxygen is usually also present in organic polymers as hydroxyl (–OH) groups or oxides from metals.We can detect C peaks in our current EDX system at higher voltage.
It can be observed from SEM images (Fig. 6) that coat-ing is uniform without any visible crack and there is no ag-glomeration of nano Ti and Si-particles in the polymer ma-trix ?lms. EDX analysis of the coated sample shows that Ti
and Si and their Oxide completely covered the metal sur-face. These types of compact arrangement of particles re-sist nucleation and extension of micro cracks, resulting in better surface coverage, strength and toughness. The thick-ness of the ?lms was estimated by the cross-section analy-sis (Fig. 7) and is about 5–6m m.
3.6.Corrosion Performance Study 3.6.1.Salt Spray Study (ASTM B-117)
Salt spray result indicates about the good corrosion re-sistance of metal sample coated with titania sol–gel coating which may be due to the three dimentional network of poly-condensation of Ti(OH)4and silane group and adherence to the metal substrate through hydrogen bond between func-tionalise titania and metal substrate immediately after appli-cation. These bonds can be transformed into stable covalent bond during the baking and curing process.13)Even after 400h exposure time in ASTM B117 salt spray chamber (saline environment) there is no trace of blister formation on phosphated steel sheet, (Fig 8, Table 2). After 168h of exposure time CRCA panel has developed medium size blister which is converted to dense blister after 200h. This
438
?2011ISIJ Table 1.Contact angle (C.A.) and surface free energy meas-
urement.
Fig.6.
SEM and EDX study of coated sample.
Fig.7.
Depth pro?le study of coated sample by SEM-EDX.
Fig.8.Corrosion resistance study of coated samples in salt spray
chamber.Table 2.ASTM B117 salt spray test data (M-medium, D-
Danced).
coating shows good barrier and corrosion resistance proper-ties (400h for phosphated and 168h for CRCA coated sam-ple) as against bare CRCA sheet which corrodes after only 2h of exposure. The higher salt spray resistance of the developed coating may be due to the formation of strong covalent bonds between polymer molecule and metallic surface.34)It is believed that well condensed net work will generate high cross linking density. Water molecule can not easily penetrate the highly cross linking network, and help to increase the corrosion resistance properties of the
coating.
After 450h of exposure in ASTM B 117 sample shows red rust particle accumulated in some areas of the titania coated surface with the creep diameter less than 2mm and the peripherial coated area had good intact with metal sub-strate, composition of this red rust particles were analysed by SEM-EDX., from the EDX spectrum, as shown in Fig.9, it has been observed that these red rust particles are com-posed of Fe, Si, O, Cl and Na. This con?rms that nano tita-nia coating provides a good barrier property and even after 400h of expose in salt spray chamber there is no free Ti-particle found in blister and rusted area (no breaking of Ti–O–Metal bond)
3.6.2.EIS Study
To assess the anticorrosive properties of the sol–gel ?lms, immersion tests in 3.5% (w/v%) NaCl solution were performed. The corrosion behaviour of the coated sub-strates was studied by the EIS method. The typical impen-dence spectra of the samples coated with titania-containing hybrid ?lms after different interval of time are presented in Fig. 10. One well de?ned time constants can be observed on the bode plots after 1-d immersion. The high frequency time constant is resulted from the capacitance of the sol–gel layer. After several days of immersion an additional time constant appears on the impedance spectrum in the low fre-quency region due to the started corrosion attack (Fig. 10and Fig. 11).
The numerical ?ttings using the appropriate equivalent circuits were used in order to estimate the evolution of cor-rosion protection properties for different coatings under study. The Randal equivalent circuits were selected for ?t-ting the experimental results basing on the physico-chemi-cal model of the corrosion process. The hybrid coatings demonstrate the highest resistance, R coat , at the beginning of
439
?2011
ISIJ
Fig.9.SEM-EDX study of coated sample (after 400h salt spray
exposure).
Fig.10.EIS study of phosphated coated sample at different time
interval.
Fig.11.EIS study of CRCA coated sample at different time in-terval.
immersion. However, this resistance decreases rapidly dur-ing the ?rst 24h of contact with chloride solution. Penetra-tion of water molecules and chloride ions through the ?nest pores of the ?lm is most probably responsible for this re-sistance drop. Characteristically, the initial coating resist-ance is signi?cantly higher for coatings applied on phos-phated sheet as compared with coating applied on CRCA sheet, and the following drop in R coat is higher with coating applied on CRCA sheet. The appearance of second time constant in the initial plot for CRCA coated sheet can be ascribed to the presence of intermediate oxide ?lm at the metal/coating interface. After several days of immersion (360h), due to the onset of corrosion attack on CRCA coated sheet an additional time constant appears in the low frequency region on the impedance spectrum. Coatings ap-plied on phosphated systems have almost two orders of magnitude difference in the initial R coat . However, even after 672h of immersion, the resistance in phosphated coated sample is higher than that of initial coating resistance of CRCA coated sample. It should be noted that after 120h of immersion, CRCA coated sample demonstrates the separa-tion of the high frequency time constant by two parts. This effect may be associated with the formation of two layers in the coating during the immersion: a more defective outer layer (?rst time constant) and a dense inner layer (second time constant). Taking into the account the presence of two layers, the ?tting results show that the capacitance of the ?rst layer is 30 times lower than the second one, which sup-ports an assumption of the separation of sol–gel ?lm this small change in impedance value is possible due to the high crosslinking density (high T g ) of the polymer net work formed by nano titania-hybrid coating and also due to the hydrophobic surface of the coating, therefore water mole-cules or any other corrosive ingredient do not penetrate through the surface of the coatings. This provides a good barrier property.35,36)
Figure 12shows the typical results of poltentiodynamic polarisation curves of Ti-coated sample, Ti-coated sample after 400h expose in 3.5% (w/v%) NaCl solution and bare CRCA sheet. All the measurements were carried out in 3.5% (w/v%) NaCl solution in air at room temperature.Even after 360h of exposure in 3.5% (w/v%) NaCl solu-tion, Ti-coated sample shows less corrosion current than bare substrate. This is due to very good barrier properties of the coating. This corrosion resistance property is sup-ported by high contact angle, low free surface energy, and high T g value.
4.Conclusion
As indicated by salt spray test, corrosion resistance en-hanced from about 2h to 168–400h by nano structural sol–gel coating is due to the barrier developed between the substrate and corrosive medium. The surface coverage by the nano particles (2–5nm) formed by controlling the growth during hydrolysis and condensation appears to be more or less uniform. The coating adhesion to the surface may be due to the formation of covalent bonds between the polymer molecules and metal surface.
Acknowledgement
Authors would like to thank the Director RD & T, Tata Steel Limited for permission and encouragement to carry out this work and also acknowledge the valuable support of Mr. A. K. Singh provided during this work.
REFERENCES
1) C. J. Brinker and G. W . Sherer: Sol–Gel Science, The Principle and
Chemistry of Sol–Gel Processing, Academic Press, New Y ork,(1989).
2)T. Ogoshi and Y . Chujo: Compos.Interfaces , 11(2005), 539.3) C. H. Landy and B. K. Coltrain: Polymer , 33(1992), 1486.4) A .B. Brennan and G. L. Wilkes: Polymer , 32(1991), 733.5)Y . Tong and Y . Liu: J. Appl. Polym. Sci., 83(2002), 1810.
6)J. Gilberts and A. H. A. Tinnemas: J. Sol–Gel Sci. Technol., 11
(1998), 153.
7) C. Sanchez and B. Jullian: J. Mater. Chem., 15(2005), 3559.8)P . Judeinstein and C. Sanchez: J. Mater. Chem., 6(1996), 511.9)Y . Wei and R. Bakthavatehalam: Chem. Mater., 2(1990), 337.
10)M. E. L Wouters and D. P . Wolfs: Prog. Org. Coat., 51(2004), 312.11)G. Bayramoglu and M. V . Kahraman: Prog. Org. Coat., 57(2006),
50.
12)R. L. T wite and G. P . Bierwagen: Prog. Org. Coat., 33(1998), No. 2,
91.
13)M. L. Zheludkevich: J. Mater. Chem., 15(2005), 5099.
14)T. L. Metroke and R. L. Parkhill: Prog. Org. Coat., 41(2001), No. 4,
233.
15)M. Khobaib and L. B. Reynolds: Sur f. Coat. Technol., 140(2001),
No. 1, 16.
16)M. S. Donley and R. AMantz: Prog. Org. Coat., 41(2001), No. 4,
233.
17)Y . J. Du, M. Damron and G. Tang: Prog. Org. Coat., 47(2003), 401.18) C. Sanchez and G. J. De: Chem. Mater., 13(2001), 3061.
19)S. Hofaccker and M. Mechtel: Prog. Org. Coat., 45(2002), 159.20)M. L. Zheludkevich and R. Serra: Acta , 51(2005), 208.
21)M. L. Zheludkevich and R. Serra: Electrochem. Commun., 7(2005),
836.
22)M. L. Zheludkevich and R. Serra: Surf. Coat. Technol., 200(2006),
3084.
23)M. L. Zheludkevich: J. Mater. Chem., 15(2005), 5099.24)T. P . Chou: J. Sol–Gel Sci. Technol., 26(2003), 321.25)T. Metroke: J. Sol–Gel Sci. Technol., 51(2009), 23.26)T. Lu: Powder Technol., 188(2009), 264.
27)R. Dholam: Int. J. Hydrogen Energy , 33(2008), 6896.28)J. L. H. Chau and C.-t. Tung: Mater. Lett., 62(2008), 3416.29)T. K. Rout: Scr. Mater., 58(2008), 473.
30)P . D. Moran and C. E. F . Rickard: Inorg. Chem., 37(1998), 1414.31)J. Franc and D. B. Lanc: Mater. Sci. Eng. B , 129(2006), 180.
32)M .D. Hernandez-Alonso and I. Tejedor: Thin Solid Films , 502
(2006), 125.
33)S. I. Seok: Surf. Coat. Technol., 200(2006), 3468.
34)Y . Zhu and C. Ding: J. Euro. Ceram. Soc., 20(2000), 127.35)T. K Rout: Scr. Mater., 56(2007), 573.
36)T. Valente and F . P . Galliano: Surf. Coat. Technol., 127(2000), 86.
440
?2011
ISIJ Fig.12.Taffel polarisation study of coated sample.