
Real-time veri?cation of multileaf collimator-driven radiotherapy using a novel optical attenuation-based?uence monitor Mathieu Goulet,Luc Gingras,and Luc Beaulieu a?
Département de Radio-Oncologie et Centre de Recherche en Cancérologie,H?tel-Dieu de Québec,
11C?te du Palais,Québec,Québec G1R2J6,Canada and Département de Physique,
de Génie Physique et d’Optique,UniversitéLaval,Québec,Québec G1V0A6,Canada
?Received8September2010;revised11January2011;accepted for publication12January2011;
published22February2011?
Purpose:Multileaf collimator?MLC?-driven conformal radiotherapy modalities?e.g.,such as intensity-modulated radiotherapy?IMRT?,intensity-modulated arc therapy,and stereotactic body radiotherapy?are more subject to delivery errors and dose calculation inaccuracies than standard modalities.Fluence monitoring during treatment delivery could reduce such errors by allowing an independent interface to quantify and assess measured difference between the delivered and planned treatment administration.We developed an optical attenuation-based detector to monitor ?uence for the on-line quality control of radiotherapy delivery.The purpose of the current study was to develop the theoretical background of the invention and to evaluate the detector’s perfor-mance both statistically and in clinical situations.
Methods:We aligned6027-cm scintillating?bers coupled to a photodetector via clear optical ?bers in the direction of motion of each of the60leaf pairs of a120leaves Millenium MLC on a Varian Clinac iX.We developed a theoretical model to predict the intensity of light collected on each side of the scintillating?bers when placed under radiation?elds of varying sizes,intensities, and positions.The model showed that both the central position of the radiation?eld on the?ber?x c?and the integral?uence passing through the?ber??int?could be assessed independently in a single measurement.We evaluated the performance of the prototype by?1?measuring the intrinsic varia-tion of the measured values of x c and?int,?2?measuring the impact on the measured values of x c and?int of random leaf positioning errors introduced into IMRT?elds,and?3?comparing the predicted values of x c and?int calculated with the treatment planning software to the measured values of x c and?int in order to assess the predictive effectiveness of the developed theoretical model.
Results:We observed a very low intrinsic dispersion,dominated by Poisson statistics,for both x c ?standard deviations of less than1mm?and?int?standard deviations of less than0.20%?.When confronted with random leaf positioning errors from IMRT segments,?int was highly sensitive to single leaf positioning errors as small as1mm at isocenter,while x c was sensitive to leaf pair translation errors of at least2mm at isocenter.Owing to the uncertainties in the doses calculated in regions of high perpendicular dose gradients,the measured values of x c and?int deviated from the predicted values of x c and?int by a mean of1.3mm and2.6%,respectively.
Conclusion:Our study showed that an optical attenuation-based detector can be used to effectively monitor integral?uence during radiotherapy delivery.The performance of such a system would enable real-time quality control of the incident?uence in current MLC-driven treatments such as IMRT and future adaptive radiotherapy procedures where new treatment plans will have to be delivered without passing thru the current standard quality control chain.?2011American Asso-ciation of Physicists in Medicine.?DOI:10.1118/1.3549766?
Key words:real-time?uence monitoring,adaptive treatment validation,quality assurance,MLC, semiconductor detectors
I.INTRODUCTION
Many of the most advanced modes of radiotherapy use mul-
tileaf collimators?MLCs?to shape the radiation beam.MLC-
driven treatment modalities such as intensity-modulated
radiotherapy?IMRT?,1–4intensity-modulated arc therapy ?IMAT?5,6or stereotactic body radiotherapy?SBRT?7?are in-herently more complex in treatment planning,radiation de-
livery,and software-to-hardware communication than their
standard counterparts and are thus more prone to errors in
radiation delivery and leaf positioning.8
Because these techniques use complex combinations of often small and irregularly shaped?elds to produce confor-mal radiation dose distributions,a leaf positioning error of only a few millimeters could markedly alter the dose delivered9,10and thus the quality of treatment.Moreover, large deviations from the planned treatment could lead to under-or overdosage and severely injure patients.Further-more,investigators are developing and testing adaptive radiotherapy procedures in which MLC?eld shapes and dose contributions are modi?ed during or just before
14591459 Med.Phys.38…3…,March20110094-2405/2011/38…3…/1459/9/$30.00?2011Am.Assoc.Phys.Med.
treatment.11,12These novel procedures will require new ways of performing on-line treatment quality control.Such consid-erations generate the need for a device independent of the radiation delivery system that can be used to perform on-line veri?cation and quality control of radiation treatments.
The concept of using independent devices for on-line?eld
veri?cation has been investigated recently.Poppe et al.13,14
showed that a multiwire ionization chamber in which each
wire serves as a dose line integrator for each MLC leaf pair
could be used for?eld monitoring.IBA Dosimetry?Uppsala,
Sweden?commercialized an on-line dosimetry system,the
COMPASS,15using an array of1600ionization chambers to
conduct dose calculation and?eld monitoring.More re-
cently,Islam et al.16developed an IMRT monitoring system
based on a large-area ionization chamber featuring linearly
varying electrode separation along the MLC’s direction of
motion.One drawback in the concept of a?uence transmis-
sion detector is that it necessarily perturbs the incoming ra-
diation beam on the patient,possibly altering the commis-
sioning of the linac.Thus,efforts have been directed toward
maximizing and uniformizing the transmission factor of such
a detector and minimizing the surface dose increase coming
from the secondary electron?ux originating from the detec-
tor itself,17so that the detector presence in the linac head can
be accounted by a tray factor only.
Following in the footsteps of these developers,we inves-
tigated the possibility of using long scintillating?bers as a
transmission detector to monitor the incident?uence of a
linac beam.18The main advantage in using long scintillating
?bers is that they allow both integral and position coding of
their signal,so that each section of the radiation?eld?e.g.,
each MLC leaf pair?can be monitored following two criteria ?position and integral?uence?.Because of the important op-tical attenuation in scintillating?bers,a radiation dose inci-
dent on the?ber will yield light output dependent on the
interaction position of the incoming radiation.This property
should enable users to identify,for each MLC leaf pair,dis-
placements?translations?of the incident?uence on the scin-
tillating?bers as well as the global change of the?uence.
The probability of error detection is therefore increased be-
cause of the quantity of information available about the in-
cident?uence pattern.Moreover and because of the negli-
gible thickness of the scintillating?bers,the transmission
detector would cause only very little attenuation of the in-
coming radiation beam and acceptable surface dose increase
attributable to secondary electron?uence.
We developed a detector based on the optical attenuation
of scintillating?bers that offers an original solution for monitoring?uence and verifying radiation?elds during lin-ear accelerator use.In this study we have developed the the-oretical background of the invention and evaluated the detec-tor’s performance both statistically and in clinical situations. II.METHODS AND MATERIALS
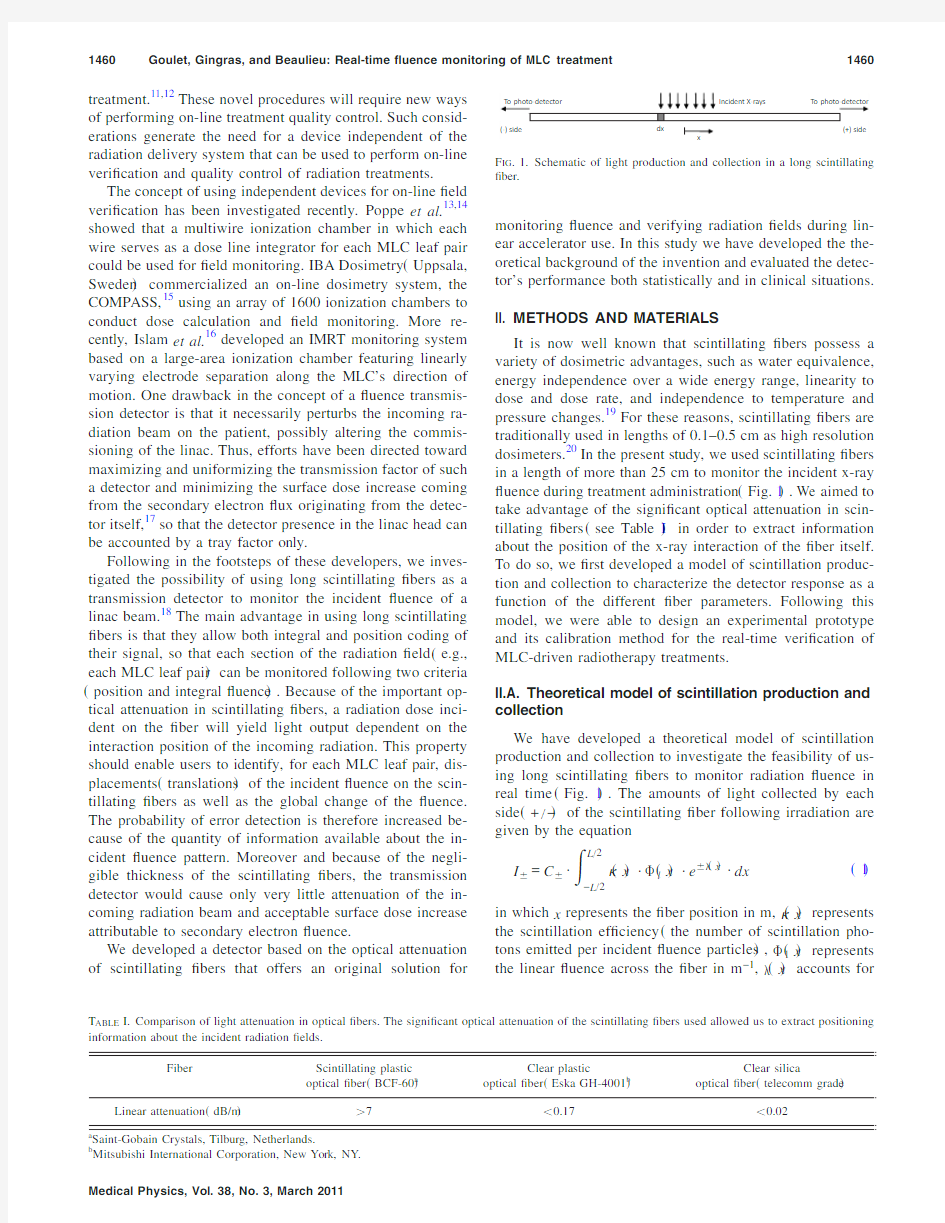
It is now well known that scintillating?bers possess a variety of dosimetric advantages,such as water equivalence, energy independence over a wide energy range,linearity to dose and dose rate,and independence to temperature and pressure changes.19For these reasons,scintillating?bers are traditionally used in lengths of0.1–0.5cm as high resolution dosimeters.20In the present study,we used scintillating?bers in a length of more than25cm to monitor the incident x-ray ?uence during treatment administration?Fig.1?.We aimed to take advantage of the signi?cant optical attenuation in scin-tillating?bers?see Table I?in order to extract information about the position of the x-ray interaction of the?ber itself. To do so,we?rst developed a model of scintillation produc-tion and collection to characterize the detector response as a function of the different?ber parameters.Following this model,we were able to design an experimental prototype and its calibration method for the real-time veri?cation of MLC-driven radiotherapy treatments.
II.A.Theoretical model of scintillation production and collection
We have developed a theoretical model of scintillation production and collection to investigate the feasibility of us-ing long scintillating?bers to monitor radiation?uence in real time?Fig.1?.The amounts of light collected by each side?+/??of the scintillating?ber following irradiation are given by the equation
I?=C?·??L/2L/2??x?·?l?x?·e???x?·dx?1?
in which x represents the?ber position in m,??x?represents the scintillation ef?ciency?the number of scintillation pho-tons emitted per incident?uence particles?,?l?x?represents the linear?uence across the?ber in m?1,??x?accounts for
F IG.1.Schematic of light production and collection in a long scintillating ?ber.
T ABLE https://www.doczj.com/doc/e43166777.html,parison of light attenuation in optical?bers.The signi?cant optical attenuation of the scintillating?bers used allowed us to extract positioning information about the incident radiation?elds.
Fiber Scintillating plastic
optical?ber?BCF-60a?
Clear plastic
optical?ber?Eska GH-4001b?
Clear silica
optical?ber?telecomm grade?
Linear attenuation?dB/m??7?0.17?0.02
a Saint-Gobain Crystals,Tilburg,Netherlands.
b Mitsubishi International Corporation,New York,NY.
Medical Physics,Vol.38,No.3,March2011
the differential light attenuation along the optical?ber,C?
represents the light loss due to the optical coupling to the
photodetector,and L represents the length of the scintillating
?ber.The position x=0is de?ned as the center of the?ber
with respect to the radiation source.Because of the energy
independence of scintillating?bers,19??x?is assumed to be energy-independent.
In a straightforward approximation,one can consider??x?to be independent of the position on the?ber and??x?to be linear in x;that is,??x???·x,assuming homogeneous?ber composition.Moreover,one can consider?l?x?to be equiva-lent to a square function of length?and constant height?0 around its central position x c.Following these simpli?ca-tions,the?ux is determined by the equation
I??C?·?·?0·?·e?·???L/2??x c?
=C?·?·?int·e???L/2?e??x c?2?in which?represents the mean optical attenuation along the ?ber in m?1and?int refers to the integral?uence across the ?ber?namely the product of?0and??.Combining these results with a normalizing?eld of known integral?uence ??intN?centered at x c=0,we obtain:
I N??C?·?·?int N·e???L/2??2??
x c=
1
2?
ln?I+I N+·I N?I?
??3?
?int=?int N?I+I N+·I?I N??4?
Thus,the central position of the?eld?x c?and the integral ?uence incident on the detector??int=?0??can be isolated from one another by taking advantage of the simultaneous collection of light from both sides of the detector.Though the decoupling of x c and?int is only complete when??x?is constant and??x?is linear in x,the variation of x c versus?int and vice versa was found to be small experimentally.For a ?eld of varying?int,x c underwent variations of no more than 5mm,which were largely attributed to statistical variations. For a?eld of varying x c,?int underwent variations of no more than6%.Nevertheless,theoretical calculations of x c and?int from a known?uence pattern?e.g.,from the treat-ment planning data?should be conducted with the complete model?Eq.?1??.
II.B.Experimental prototype
The prototype was composed of60parallel BCF-60scin-tillating?bers?diameter,1mm;length,27cm;Saint-Gobain Crystal,Tilburg,Netherlands?embedded in a30?28cm2 acrylic phantom.The phantom had a thickness of3.2mm and was grooved on its downstream face?with respect to the radiation source?to insert the scintillating?bers.The whole assembly was placed in the accessory tray of a Varian Clinac iX linear accelerator?Varian Medical Systems,Palo Alto, CA?so that the source-to-detector distance was63.8cm.The spacing between each?ber was3.19mm for the40central ?bers and6.38mm for the20external?bers.This spacing was chosen so that the scintillating?bers matched each of the leaf pairs on a120-leaf Millennium MLC?Varian Medi-cal Systems,Palo Alto,CA?.Both ends of each scintillating ?ber were coupled to clear optical?bers?Eska GH-4001, Mitsubishi International Corporation,New York,NY?of length ranging from50to100cm to enable light collection by a single photodetector?Alta u4000m CCD camera,Apo-gee Imaging System,Roseville,CA?using an f/0.95,50mm focal length lens?JML Optical Industries,Rochester,NY?. The CCD camera was located in the treatment vault,adjacent to the linac head,and its operation was conducted with the Apogee Software Development Kit?Apogee Imaging Sys-tem,Roseville,CA?.Before analysis,the?ux images ac-quired by the CCD camera were treated for transient noise coming from stray radiation.21A schematic and actual view of the prototype can be found in Figs.2and3,respectively. II.C.Prototype calibration
Before the theoretical detector response could be calcu-lated using Eq.?1?,??x?and??x?were determined for all scintillating?bers using a0.5–1cm wide rectangular?eld incident on the?ber array.The scintillating?bers were po-sitioned at isocenter and aligned perpendicularly to the rect-angular?eld,and the radiation?eld was30–40cm long, suf?cient to enable simultaneous irradiation of all the?bers.
F IG.2.Simpli?ed schematic of the experimental prototype used.Scintillat-ing?bers?gray?were aligned with respect
to the radiation?eld?hatched lines?to match each multileaf collimator leaf to a single?ber.The light was guided by clear optical?bers?black?and collected by a photodetector.The prototype was located in the accessory tray.
F IG.3.Actual view of the experimental prototype used.The device is aimed to be placed in the accessory tray of the linac so that?uence veri?cation can take place during the treatment delivery.?a?Top view of the unmounted prototype,?b?prototype mounted in the accessory tray,and?c?bottom view of the prototype,where the parallel scintillating?bers are shown.
Medical Physics,Vol.38,No.3,March2011
Assuming the radiation?eld is localized around its central
position x f,the integral mean value theorem on Eq.?1?can
be used to?nd:
I?=C?·??x0?·?int?x0?·e???x0?x0??x f?d2,x f+d2??5?where d represents the effective rectangular?eld width?that
is,the width beyond which the radiation?uence is consid-
ered to be negligible?and x0represents the effective point of
measurement as de?ned by the integral mean value theorem.
If d is small,it is assumed that x0is equivalent to x f because ?is approximately constant along the interval;?l is sym-metrical with respect to x f;and the variation of?is small
along the interval.Having deduced that x0?x f,the values of ??x?and??x?could be computed at this position on the?ber:
??x f?=1
2ln?I+?x f?I??x f?·I??0?I+?0?
??6?
??x f???0?=?I+?x f?
I+?0?
·
I??x f?
I??0?
?7?
The value of??x?is de?ned with respect to the value of?at the?ber center?i.e.,x f=0?,a constant which cancels itself in the calculation of x c and?int for a given radiation?eld?Eqs.?3?and?4??.
II.D.Intrinsic prototype performance quanti?cation To quantify the intrinsic performance of our prototype,we measured the light output collected by the CCD camera for a variety of leaf openings and central positions with the proto-type in the accessory tray mount.These con?gurations were obtained using simple triangular and rectangular?elds?Fig. 4?.The leaf openings obtained using these radiation?elds ranged from0.05to12cm?at isocenter?while the central positions varied from?5to5cm?at isocenter,0being de-?ned as the central position on the?ber?and the pro-grammed?uence on the linac ranged from1to5monitoring units?MU?.For each con?guration,we obtained?ve mea-surements of x c and?int to calculate the standard deviations ?SDs?inherent to this MLC layout.II.E.Detection of random leaf positioning errors To evaluate the prototype performance in a more realistic
clinical situation,we introduced random leaf positioning er-
rors to7–14step-and-shoot IMRT?elds from a clinical head
and neck plan by manually modifying each of the MLC po-
sition?les produced by the treatment planning software?Fig.
5?.The programmed?uence on the linac was8MU for each
segment and the leaf openings varied from0.5to5cm.
We classi?ed the random errors as either single leaf er-
rors,in which an individual leaf was moved from its original
position by a certain amount,or pair translation errors,in
which both leaves of a pair of leaves were moved the same
distance in the same direction to preserve the opening length
between the two.Single leaf errors are expected to result in
more radiation output modi?cation than pair translation er-
rors.On the other hand,pair translation errors are expected
to produce a systematic shift of the position of the radiation
?eld.We also investigated the impact of leaf bank errors,in
which all the leaves in one leaf bank underwent single leaf
errors,and?eld translation errors,in which both leaf banks
underwent the same parallel displacement?analogous to pair
translation errors?.The magnitude of the leaf shift???ranged
from1to5mm.The measured modi?ed segments were each
normalized to the original segment on which no error was
intentionally included so that the predicted values for x c and ?int were zero and unity,respectively.
II.F.Predicted x c and?int calculation and comparison We investigated the predictive capability of the detector
response of our theoretical model using the same IMRT
?elds as in the preceding section.For dose calculation con-
sistency,the prototype was placed at isocenter in a30?30?3cm3solid water phantom with a98-cm source-to-surface distance and a100-cm source-to-detector distance.
The water phantom was grooved to receive20scintillating
?bers,all at1cm separation and aligned with20of the40
central leaf pairs on the linac’s MLC.For normalization,we
used the prototype to measure a rectangular5?40cm2ra-
diation?eld.
To calculate the predicted values of x c and?int in Eqs.?3?
and?4?,we used the planar dose data from the treatment
F IG.4.Simple?elds used for intrinsic deviation measurements of the pro-totype.Triangular?elds?left?of varying angle?were used to maintain the central position of the interaction?x c?while varying the integral?uence on the?ber??int?.Inversely,rectangular?elds?right?of varying width t were
used to maintain?int while varying x c.The dashed lines represent scintillat-ing?bers locations.
F IG.5.Illustration of the random errors induced on the selected step-and-shoot head and neck IMRT?elds.?denotes the magnitude of the leaf shift. The errors were classi?ed as?a?single leaf positioning errors,?b?pair trans-lation errors,?c?leaf bank positioning errors and?d??eld translation errors.
Medical Physics,Vol.38,No.3,March2011
planning software?Pinnacle38.0m,Philips Healthcare,An-
dover,MA?and the experimentally measured??x?and??x?.
A rectangular5?40cm2radiation?eld was used as the nor-
malization?eld in order to perform the calculation of x c and ?int.The?elds were then delivered to the prototype,and the measured x c and?int values were compared to the predicted
ones.We quanti?ed each of the observed differences by
evaluating their p-values,taking the standard deviation of the
distribution of mean measured x c or?int as predicted by
Poisson statistics on the measured light intensities.We clas-
si?ed each difference with a p-value of more than0.01as
being explainable by Poisson statistics?statistically insigni?-
cant?.
II.G.In?uence of the detector on the beam
The in?uence of the prototype on a6MV beam was in-
vestigated by evaluating the beam transmission,the increase
in surface dose and the variation in percent depth dose ?PDD?and relative pro?les for a?eld size of5?5,10?10, and20?20cm2.Beam transmission factors were evaluated in a30?30?20cm3water phantom with a90-cm source-to-surface distance?SSD?and a depth of10cm using a par-allel plate ionization chamber?Exradin A11TW,Standard Imaging,Middleton,WI?with and without the prototype in place in the accessory tray of the linac.Surface doses were evaluated in the same way by measuring the response of the parallel plate ionization chamber at the surface of the phan-tom.The effective point of measurement of the chamber was within10?m of the phantom surface.The augmentation of the surface dose was calculated with respect to the dose at10 cm depth using the following formula:
S r=D0,Proto
D10,Proto
·?D0,open D10,open
??1?8?
where D0,proto and D10,proto represent the dose measured with the prototype in the?eld at a depth of0and10cm,respec-tively,and D0,open and D10,open represent the dose measured without the prototype in the?eld at a depth of0and10cm, respectively.Relative pro?les and depth dose were acquired using a Farmer-type ionization chamber?Exradin A12,Stan-dard Imaging,Middleton,WI?in a water tank with a90-cm source-to-surface distance.For comparison purposes,the beam transmission and the increase in surface dose were also measured for a8mm thick Varian acrylic block tray.
III.RESULTS
III.A.Intrinsic x c and?int variations
The SDs of measured x c and?int values are plotted with respect to?eld width for a programmed?uence of1MU and 5MU in Fig.6.For any?eld wider than2cm at1MU,the detector achieved a x c SD of less than1mm.This variation was greatly reduced as the radiation dose increased.For a programmed?uence equal to5MU,any?eld down to0.05 cm width exhibited an SD of less than1mm.Moreover,the SD of the?int did not exceed0.4%of the total?uence for any?eld greater than0.05cm at1MU.For5MU,the SD
reached vanishing values below0.2%for any?eld down to
0.05cm width.
https://www.doczj.com/doc/e43166777.html,parison between modi?ed and error-free segment
The x c and?int difference between the modi?ed and the
error-free segments for each type of leaf positioning error are
shown in Table II.?int exhibited a variation of more than1%
for any single leaf error or leaf bank error of1mm or more.
However,for a pair translation error or?eld translation error
of1mm,?int showed a variation of less than0.3%.For x c,
any displacement of the geometric center of the?uence of at
least1.5mm for a single leaf pair?corresponding to a single
leaf error of3mm or a pair translation error of1.5mm?
altered the value of x c by more than5SDs?as calculated
with Poisson statistics?.Errors affecting whole leaf banks
reduced the geometric shift of the?uence pattern required to
obtain an increase in x c of more than5SDs to1mm?e.g.,a
leaf bank error of2mm or a?eld translation error of1mm?. III.C.Predicted vs measured x c and?int values Absolute differences between the predicted values of x c
and?int obtained using the treatment planning software and
the measured values of x c and?int are shown in Table III.
Most of the measured x c values were within4mm of the
predicted x c values?mean absolute difference of1.3mm?.
Poisson statistics alone could account for only slightly more
than half of the deviations observed.The absolute differences
observed for?int were punctuated by some very high values ?range of5%–20%?that occurred when the leaves were po-sitioned near a perpendicular dose gradient—e.g.,when an
open pair of leaves was adjacent to a partially or totally
closed pair as in the case of the lower and upper leaf pairs of
one segment.The mean absolute difference of the measured ?int values from the predicted?int values was2.6%;how-ever,this mean reduced to1.9%when the upper and lower leaves of each segment were excluded.
C
e
n
t
r
a
l
p
o
s
i
t
i
o
n
S
D
(
m
m
)
Leaf opening length at isocenter(cm)
T
o
t
a
l
f
l
u
e
n
c
e
S
D
(
%
)
F IG.6.Detector performance calculation in terms of SD.Black dots repre-sent SDs from experimental measurements.Equivalent SDs calculated using Poisson statistics are plotted in a thick gray line.
Medical Physics,Vol.38,No.3,March2011
III.D.In?uence of the prototype of the radiation beam The beam transmission factor measured for all?eld sizes was?0.983?0.003?.The increase in surface dose?S r?
was found to be?1.043?0.003?,?1.112?0.003?,and ?1.209?0.006?for?eld areas of5?5,10?10,and20?20cm2,respectively.Changes in PDD were found to be within0.5%for a depth greater than d max.Changes in rela-tive dose pro?les at d max and at a depth of10cm were found to be within1%.
For the Varian block tray,the beam transmission factor measured for all?eld sizes was?0.953?0.003?.The increase in surface dose?S r?was found to be?1.062?0.003?,?1.167?0.004?,and?1.318?0.007?for?eld areas of5?5, 10?10,and20?20cm2,respectively.
Transmission factors and surface dose increases are com-
piled in Table IV,along with equivalent values for published
results concerning other transmission detectors.
IV.DISCUSSION
We developed a theoretical model of scintillation produc-
tion and collection that demonstrated that both positioning ?x c?and integral??int?information about the incident?uence pattern could be obtained from the readings of each scintil-
lating?ber.The statistical variation of x c and?int was very
low so that when comparing directly two IMRT radiation
?elds both x c and?int showed a great sensitivity to leaf po-
sitioning https://www.doczj.com/doc/e43166777.html,ing the above-mentioned theoretical
T ABLE II.Differences observed in the central position of the radiation?eld on the?ber?x c?and the integral?uence passing through the detector??int?between modi?ed segments including random errors and error-free segments of selected step-and-shoot head and neck IMRT?elds?8MU programmed for each segment;length of?ber irradiated:0.5–5.0cm?.
Error type
?a
?mm?
No.of standard deviations in x c Percentage deviation in?int Unmodi?ed leaves
?maximum?
Modi?ed leaves
?mean?
Unmodi?ed leaves
?maximum?
Modi?ed leaves
?mean?
Single leaf1 4.0 2.30.73 1.1
2 3.8 2.2
3 5.6 3.4
47.7 4.5
59.9 5.6
Pair translation1 4.2 4.00.450.22
28.10.75
311.80.90
414.5 1.51
518.0 1.91 Single leaf bank1N/A 3.5N/A 1.5
2 6.9 3.5
311.1 5.6
414.97.2
518.99.0 Field translation1N/A 6.3N/A0.09
212.30.09
319.00.28
425.30.18
531.60.50
a Magnitude of the leaf shift,as depicted in Fig.5.
T ABLE III.Difference between measured and predicted values calculated using the treatment planning software for the central interaction position on the?ber ?x c?and the integral?uence passing through the detector??int?in selected step-and-shoot?elds?MU programmed for each segment:8to11;length of?ber irradiated:0.5–5.0cm?from an intensity-modulated radiotherapy regimen for a patient with head and neck cancer.
Parameter Multileaf collimator
leaves included
Mean absolute
deviation from the
calculated values
Proportion of all
differences under
2mm or2%?%of total?
Proportion of all
differences under
4mm or4%?%of total?
Proportion of all
differences attributable
to intrinsic parameter
variations?p?0.01??%of total?
x c All 1.3mm779851 Inner a 1.2mm819854?int All 2.6%63787 Inner a 1.9%77899 a Inner leaves:leaves other than the upper and lower open leaves of each segment.
Medical Physics,Vol.38,No.3,March2011
model,we were able to predict both x c and?int at a moderate precision level,mainly because of the uncertainties in the dose calculation performed in Pinnacle3.
IV.A.Detecting random leaf positioning errors The?uence detector showed little intrinsic statistical variation on the value of x c and?int?Fig.6?.These varia-
tions directly quanti?ed the smallest statistically signi?cant error that could be detected by our https://www.doczj.com/doc/e43166777.html,ly,given that a p-value of0.01between the predicted and measured values is considered signi?cant,the prototype could detect errors of0.8mm in x c and0.10%in?int for a5-MU pro-grammed?uence and a?eld width of3cm.This perfor-mance is achieved because the only source of uncertainty in the measurement process is statistical in nature,as shown by the predictability of the SDs by Poisson statistics.The reader should note that the somewhat higher SDs observed for a ?uence of1MU are caused by the intrinsic variability of the linac’s delivery system:although the latter was corrected with a reference ionization chamber,a0.1%–0.2%variability could still be observed.The optimal precision for this detec-tor is reached if the monitored?eld is compared to an iden-tical,error-free segment of the same con?guration,as pro-posed by Poppe et al.13
We evaluated this latter procedure in detecting four types of leaf errors.The deviations of x c for unmodi?ed,error-free leaves did not exceed5SDs?as calculated with Poisson sta-tistics?,while the deviations of?int for the same leaves did not exceed0.8%?Table II?.These observations were consis-tent with the intrinsic statistical variations previously de-picted.For the leaves on which errors were induced,?int was very sensitive to even small changes in the leaf pair opening. Any single leaf error or leaf bank error of1mm or more induced a variation of more than1%of?int,which was considered signi?cant when compared to the variation of un-modi?ed leaves.On the other hand,?int was less sensitive to pair translation errors or?eld translation errors,in which a larger displacement of leaves was necessary to modify sig-ni?cantly the primary?uence.Position coding as measured by x c varied most when confronted with pair translation er-rors or?eld translation errors.A2-mm pair translation error or a1-mm?eld translation error induced a variation in x c of more than5SDs,which was signi?cantly higher than the variation in x c using unmodi?ed leaves.However,x c was less sensitive to single leaf errors and leaf bank errors,in which larger displacements of the leaves?3and2mm,respectively?were necessary to signi?cantly modify the geometric center of the radiation?eld incident on the?ber.Thus,?int and x c are complementary parameters that confer highly precise er-ror detection in MLC position and total?uence for each leaf pair.
IV.B.Precision of predicted vs measured x c and?int values comparisons
The quality of the comparison between the predicted and measured values of x c and?int was highly dependent on the con?guration of the analyzed leaf pair.For leaves near per-pendicular dose gradients?as occurs for the leaves at the top and bottom of each segment?,the deviation was many times greater than for the leaves positioned in near-rectangular con?gurations with neighboring leaves.One explanation for this behavior is that the treatment planning software failed to precisely compute the dose incident on the?ber in situations of high perpendicular dose gradient.Indeed,the planar dose in Pinnacle3was calculated using a dose grid resolution of2 mm;the dose at each point on the?ber was interpolated from these values.As the scintillating?ber itself had a smaller diameter of1mm in the direction perpendicular to the move-ment of the MLC leaves,it was more sensitive to steep dose gradient,like in situation where the analyzed leaf pair was adjacent to a partially or totally closed one.This imprecision in the calculation led to high differences between the pre-dicted and measured values of x c and especially?int,which was more sensitive to?uence variation across the?ber. Overall,the method used can predict x c to a precision of4 mm and?int to a precision of more than4%,which may not be precise enough for its use in real-time veri?cation of the incoming radiation?eld.The overall precision of the calcu-lation could be improved if an alternate and more precise ?uence calculation software were used,and should be the outlook of further studies.However,undesired deviations caused by dose calculation uncertainties could be eliminated
T ABLE https://www.doczj.com/doc/e43166777.html,parison in transmission factors and surface dose increase between the prototype used in this study,a8mm thick Varian acrylic block tray and other transmission detectors used in on-line?eld monitoring?comparison between these values must be made with care,as the methodology and?eld sizes used may differ from one study to another?.
Parameter Field size
?cm2?This study Varian block tray
DA VID
?Ref.17?
COMPASS
?Ref.15?
IQM-AIMS
?Ref.16?
Transmission factor at6MV Varies0.9830.9530.928to0.9390.9670.93
Increase in surface dose?S r?a at6MV?SSD90cm?
5?5 1.04 1.06?1b 1.15N/A 10?10 1.11 1.17 1.03b 1.20 1.15 20?20 1.21 1.32 1.11b 1.30N/A
Source-to-detector distance?cm?–64654465?64
a Calculated using Eq.?8?.Each surface dose was normalized to a reference value,either the dose at10cm?this study,Poppe et al.?or d
max ?Venkataraman
et al.,Islam et al.?.As all study report no signi?cant differences in percent depth dose at a depth greater or equal than d max,these normalizations were considered equivalent in the calculation of S r.
b Data extrapolated from known measurements of surface normalized dose in a water phantom at0and1.5mm.
Medical Physics,Vol.38,No.3,March2011
if an error-free measurement of the same?eld were used as a comparative metric?as in the preceding section?.
IV.C.Proposed real-time control routine
Our prototype was most effective when the incident radia-tion?eld was compared directly to a previously measured error-free?eld.However,before this radiation?eld can be considered truly error-free,it must be veri?ed using another means of comparison.In this respect,measuring the refer-ence values of x c and?int during the standard quality assur-ance test?QA?of the?eld would be most useful.Therefore, an ef?cient routine for the on-line quality control of MLC-driven radiotherapy might be the following:
?a?During the QA preceding the treatment the measure-ments of x c and?int are saved for later comparisons.?b?During the ensuing radiation fractions,the measured x c and?int are compared in real-time to the values of x c and?int saved at the end of?a?.
?c?If the detector observes any difference between the measured and reference x c and?int larger than a pre-determined threshold?evaluated in terms of SDs from Poisson statistics for x c or in terms of percent for?int?, the detector can activate a customer-speci?c action such as signaling a linear accelerator interlock to stop radiation delivery.This would give time to the user to acknowledge the error detection and take a decision for the following course of events.
Because each MLC pair is veri?ed independently,one could choose an interlock threshold of different magnitudes for each leaf pair or for any combination of leaf pairs within a?eld depending on different factors such as perpendicular dose gradients,proximity of at-risk organs,and?eld abut-ment regions.
https://www.doczj.com/doc/e43166777.html,parison with existing commercial devices In this section we compare the behavior of different trans-mission detectors used for the on-line veri?cation of the in-cident?uence.The other systems having published results to this date are the DA VID?PTW,Freiburg,Germany?studied by Poppe et al.,17the COMPASS?IBA Dosimetry,Uppsala, Sweden?studied by Venkataraman et al.,15and the AIMS chamber,part of the IQM system studied by Islam et al.16 The comparison basis will focus on detection capability, beam attenuation,beam quality,and surface dose increase. Compiled data from all studies?including this one?concern-ing the beam transmission factor and surface dose increase ?S r calculated with Eq.?8??are available in Table IV.
In terms of detection capability,the DA VID has shown an excellent detection capability to a wide range of clinical and arti?cial errors.More speci?cally,the2006version of the system13was able to detect a single leaf error of1mm for any?eld size down to1?1cm2.However,little is known of the detector capability to detect absolute displacement of the radiation?eld in the direction of the acquisition wires. Since the DA VID signal represents the ionization integration along each MLC leaf pair?equivalent to?int in the present study?,it is expected that pair translation errors and espe-cially?eld translation errors will be more dif?cult to detect. The sensitivity of the IQM to leaf bank and single leaf errors seems to be higher for smaller?elds than for larger?elds. The system easily detected a single leaf error of3mm and a leaf bank error of1mm for a?eld of3?3cm2.Of these two errors,only the leaf bank error seems to be detected for a?eld of15?15cm2.The IQM has also reported successful detection of IMRT?eld translation errors of3mm.Unfortu-nately,no detection capability data is currently available for the COMPASS in the literature.
The transmission factor measured with our system was by far the highest of all reported devices.This is mainly due to the fact that very little material?essentially3mm thick acrylic?is positioned in the beam.This could be an advan-tage in surface and MLC leakage dose reduction,since a smaller tray factor?hence a smaller MU increase?needs to be programmed in the treatment planning system to compensate for the detector.For all known devices,no signi?cant beam quality alteration is detectable beyond d max for all investi-gated energies.
Equation?8?was chosen to calculate surface dose in-crease because it considers the beam correction factor to be applied to the delivered MU at the linac to compensate for the beam attenuation.Approximate values for S r for the DA VID system were extrapolated from the data from Poppe et al.17and known measurements of surface normalized dose in a water phantom at0and1.5mm.15The surface dose measured with the DA VID was by far the smallest of all reported devices.This is mainly due to the fact that the de-vice is positioned in the wedge tray of the linac at a source-to-detector distance of only44cm,limiting the impact of the electron?uence created by the detector.It should be noted that the minimal source-to-detector distance achievable on a Varian Clinac iX is superior to55cm?the approximate po-sition of the bottom of the MLC?.As such,the DA VID is expected to produce signi?cantly more surface dose increase on the Varian linac used in this study.The other detectors, including ours,have a source-to-detector distance ranging from63to65cm.Of these,our detector showed the smallest increase in surface dose,a feature probably attributable to the highest beam transmission values of all detectors.
IV.E.Study potential limitations
Preceding work on scintillating?ber dosimeters22showed that the Cerenkov light produced in plastic optical?bers con-stituted an important part of the collected light signal from the dosimeter.In this study,the contribution of Cerenkov light over scintillation was considered negligible and thus not taken into account in our derivation calculations because no clear collection?bers were directly irradiated and because Cerenkov radiation produces only a small amount of light per unit length of irradiated plastic23compared to the scin-tillation light yield of scintillating?bers.
The increase in surface dose caused by the detector may be considered a little high for clinical applications.However
Medical Physics,Vol.38,No.3,March2011
and because of the small diameter of scintillating?bers,a
device analog to the one presented in this study could be
placed in the wedge tray of the linac,hereby reducing the
secondary electron?uence created by the detector,especially
for small source-to-surface distances.
V.CONCLUSION
We have introduced and validated a novel?uence trans-
mission detector that has excellent intrinsic precision.This
precision was best exploited when comparing the incoming
radiation?eld with previously obtained measurements from
an error-free delivery.The monitored?eld could also be
compared with values predicted by the treatment planning
software?or an equivalent?uence calculation software?al-
beit with a reduced precision dependent of the uncertainties
in dose calculation and?ber properties determination.This
latter procedure would need further investigation before it
can be used in real-time control https://www.doczj.com/doc/e43166777.html,pared to exist-
ing transmission detectors,our device showed the highest
transmission factor and the second lowest surface dose in-
crease.Because of its dual parameter analysis,our prototype
provided real-time?uence monitoring leading to precise de-
tection of MLC leaf errors.The fact that each pair of leaves
in the MLC is veri?ed independently allows one to set leaf-
dependent thresholds on the radiation?eld to assess?eld
validity in critical zones such as near at-risk organs. ACKNOWLEDGMENTS
The authors would like to thank Mathieu Guillot,Sam
Beddar,and the Centre Hospitalier Universitaire de Québec ?CHUQ?for their contribution to this work.This research is supported in part by the Natural Sciences and Engineering
Research Council of Canada?NSERC?support Grant No.
262105.
a?Electronic mail:beaulieu@phy.ulaval.ca
1S.Spirou and C.Chui,“Generation of arbitrary intensity pro?les by dy-namic jaws or multileaf collimator,”Med.Phys.21,1031–1041?1994?. 2J.Stein,T.Bortfeld,B.Dorschel,and W.Schlegel,“Dynamic x-ray com-pensation for conformal radiotherapy by means of multileaf collimation,”Radiother.Oncol.32,163–173?1994?.
3P.Kallman et al.,“Shaping of arbitrary dose distribution by dynamic multileaf collimator,”Phys.Med.Biol.33,1291–1300?1988?.
4D.J.Convery and M.E.Rosenbloom,“The generation of intensity modu-lated?elds for conformal radiotherapy by dynamic collimation,”Phys. Med.Biol.37,1359–1374?1992?.
5C.X.Yu,“Intensity-modulated arc therapy with dynamic multileaf colli-mation:An alternative to tomotherapy,”Phys.Med.Biol.40,1435–1449?1995?.
6K.Otto,“V olumetric modulated arc therapy:IMRT in a single gantry
arc,”Med.Phys.35,310–317?2008?.
7A.S.Shiu,H.M.Kooy,J.R.Ewton,S.S.Tung,J.Wong,K.Antes,and M.H.Maor,“Comparison of miniature multileaf collimation?MMLC?with circular collimation for stereotactic treatment,”Int.J.Radiat.Oncol., Biol.,Phys.37,679–688?1997?.
8G.A.Ezzell,J.M.Galvin,D.Low,J.R.Palta,I.Rosen,M.B.Sharpe,P. Xia,Y.Xiao,L.Xing,C.X.Yu,IMRT subcommittee,and AAPM Ra-diation Therapy committee,“Guidance document on delivery,treatment planning,and clinical implementation of IMRT:Report of the IMRT Sub-committee of the AAPM Radiation Therapy Committee,”Med.Phys.30, 2089–2115?2003?.
9T.LoSasso,C.-S.Chui,and C.C.Ling,“Physical and dosimetric aspects of a multileaf collimation system used in the dynamic mode for imple-menting intensity modulated radiotherapy,”Med.Phys.25,1919–2927?1998?.
10J.H.Kung and G.T.Y.Chen,“IMRT dose delivery error from radiation ?eld offset inaccuracy,”Med.Phys.27,1617–1622?2000?.
11H.Rehbinder,C.Forsgren,and J.L?f,“Adaptive radiation therapy for compensation of errors in patient setup and treatment delivery,”Med. Phys.31?12?,3363–3371?2004?.
12D.Yan,F.Vicini,J.W.Wong,and A.Martinez,“Adaptive radiation therapy,”Phys.Med.Biol.42,123–132?1997?.
13B.Poppe,C.Thieke,D.Beyer,R.Kollhoff,A.Djouguela,A.Ruhmann, K.C.Willborn,and D.Harder,“DA VID—A translucent multi-wire trans-mission ionization chamber for in vivo veri?cation of IMRT and confor-mal irradiation techniques,”Phys.Med.Biol.51?5?,1237–1248?2006?. 14H.K.Looe,D.Harder,A.Rühmann,K.C.Willborn,and B.Poppe,“Enhanced accuracy of the permanent surveillance of IMRT deliveries by iterative deconvolution of DA VID chamber signal pro?les,”Phys.Med. Biol.55,3981–3992?2010?.
15S.Venkataraman,K.E.Malkoske,M.Jensen,K.D.Nakonechny,G. Asuni,and B.M.C.McCurdy,“The in?uence of a novel transmission detector on6MV x-ray beam characteristics,”Phys.Med.Biol.54, 3173–3183?2009?.
16M.K.Islam,B.D.Norrlinger,J.R.Smale,R.K.Heaton,D.Galbraith,C. Fan,and D.A.Jaffray,“An integral quality monitoring system for real-time veri?cation of intensity modulated radiation therapy,”Med.Phys. 36?12?,5420–5428?2009?.
17B.Poppe,H.K.Looe,N.Chofor,A.Rühmann,D.Harder,and K.C. Willborn,“Clinical performance of a transmission detector array for the permanent supervision of IMRT deliveries,”Radiother.Oncol.95,158–165?2010?.
18L.Beaulieu,L.Gingras,and M.Goulet,“Fluence monitoring devices with scintillating?bers for x-ray radiotherapy treatment and methods for calibration and validation of same,”U.S.Patent No.61,375,125?Pend-ing??2010?and CAN Patent No.2,713,375?Pending??2010?.
19A.S.Beddar,“Plastic scintillation dosimetry and its application to radio-therapy,”Radiat.Meas.41,S124–S133?2007?.
20L.Archambault,A.S.Beddar,L.Gingras,https://www.doczj.com/doc/e43166777.html,croix,R.Roy,and L. Beaulieu,“Water-equivalent dosimeter array for small-?eld external beam radiotherapy,”Med.Phys.34,1583–1592?2007?.
21L.Archambault,T.M.Briere,and S.Beddar,“Transient noise character-ization and?ltration in CCD cameras exposed to stray radiation from a medical linear accelerator,”Med.Phys.35,4342–4351?2008?.
22L.Archambault,A.S.Beddar,L.Gingras,R.Roy,and L.Beaulieu,“Measurement accuracy and Cerenkov removal for high performance, high spatial resolution scintillation dosimetry,”Med.Phys.33,128–135?2006?.
23J.V.Jelley,Cerenkov Radiation and Its Applications?Pergamon,New York,1958?.
Medical Physics,Vol.38,No.3,March2011
导体激光器与单模光纤耦合效率的分析fH,w ` [ dx#i/Ka# 一、引言] 7% CL.2Q 随着光纤加工工艺和制造技术的日益提高,在光纤通讯与光纤传感中的传输损耗已经降低到了0.154dB/km的极限程度。而光源与光纤的耦合损耗问题越来越显得突出。在光纤通讯中,由于在多模光纤中各传输模的群延迟不同,所以限制了它的应用场合[1];而在光纤传感中,多模光纤与光源的耦合相对单模光纤来说容易得多,但由于单模光纤具有较高的横向分辨力,在一些特殊的传感测试场合,还必须使用单模光纤[2]。所以,改善和提高半导体激光光源与单模光纤的耦合效率成为国内外研究的焦点。npT(iP`") 由于单模光纤的芯径只有多模光纤的十分之一,即5~10μm左右,加上激光器在垂直于结平面方向有较大的发散光束角,所以,简单的套筒式耦合无法获得较高的耦合效率[3]。况且,激光器与光纤轴线的对中容许误差只有1μm,增大了SLD-SMF光耦合的难度。为了减小SLD-SMF间的光耦合损耗,激光器的模场半径(光点尺寸)应与光纤的模场半径相互匹配起来,也就是说,使激光器的椭圆形模场转换为光纤的圆形模场,这可以通过在SLD-SMF间使用透镜来实现[4]。迄今为止,已有许多种用不同形状的透镜进行模式匹配的方法,如柱状透镜法、半球透镜法、四角锥形半椭圆透镜法、共焦透镜法及柱状透镜与自聚焦透镜组合法等[5,6];也可以用一些特种加工技术,如通过拉伸被加热的光纤端头使其形成尖锥状或在研磨后熔融光纤的末梢以及用光刻技术[7~11]直接在光纤的端头处加工出各种形状的微透镜。2d"@g* 本文将对一些典型的SLD-SMF光耦合方式进行理论上的分析,并给出一些具有实用价值的数据。并从耦合效率与成本双重角度给出了适合于实际工程应用的几种耦合方式的优选率。2-v?T6<2 i*DP:$c 二、耦合特性的理论分析1 ]_!4{f 当单模光纤的归一化频率V在1.9≤V≤2.4范围内时,对在单模光纤内光能量分布采用高斯场近似,误差在1%以内。所以,采用高斯光束模场分布来分析计算和比较各种耦合方式的耦合效率及实用性是完全可行的。SLD-SMF直接耦合原理如图1所示。图中w0为单模光纤的模场半宽,其值在理论上在计算过程中相当烦琐,在工程实际中常由下式近似[12]:jS9 ,Z" (1) h,34JYq0 (z=0,w∥1=2μm) ^NXQ>Arg b>*'C3!LF 图3耦合效率与两轴相错角度和距离的关系'O(4mysc
常用光纤器件特性测试实验 实验六 光纤活动连接器损耗测试实验 一、实验目的 1、了解光纤活动连接器插入损耗测试方法 2、了解光纤活动连接器回波损耗测试方法 3、掌握它们的正确使用方法 二、实验要求 1、测量活动连接器的插入损耗 2、测量活动连接器的回波损耗 三、预备知识 1、了解活动连接器的特点、特性 四、实验仪器 1、ZY12OFCom13BG3型光纤通信原理实验箱 1台 2、FC 接口光功率计 1台 3、万用表 1台 4、FC/PC-FC/PC 单模光跳线 2根 5、FC-FC 法兰盘 1个 6、Y 型分路器 1个 7、连接导线 20根 五、实验原理 光纤活动连接器是连接两根光纤或光缆形成连接光通路且可以重复装拆的无源器件。其外形与普通电缆连接器有点相似,但其内部结构复杂,机械加工精度要求高。主要技术要求是插入损耗小,拆卸方便,互换性好,重复插拔的寿命长。它还具有将光纤与有源器件、光纤与其它无源器件、光纤与系统和仪表进行活动连接的功能。 评价一个活动连接器的性能指标有很多,其中最重要的指标有4个,即插入损耗、回波损耗、重复性和互换性。 光纤活动连接器插入损耗是指光纤中的光信号通过活动连接器之后,其输出光功率相对输入光功率的分贝数,计算公式为: )lg(1010P P I L (6-1) 其中P 0为输入端的光功率,P 1为输出端的光功率。 对于多模光纤连接器来讲,注入的光功率应当经过扰模器,滤去高次模,使光纤中的模式为稳态分布,这样才能准确地衡量连接器的插入损耗。光纤活动连接器的插入损耗越小越好。 光纤活动连接器插入损耗测试方法为:向光发端机的数字驱动电路送入一伪随机信号(长度为24位),保持注入电流恒定。将活动连接器连接在光发端机与光功率计之间,记下
?光纤准直器是光无源器件中的一个重要的组件,在光通信系统中有着非常普遍的应用。 它是由单模尾纤和准直透镜组成,具有低插入损耗,高回波损耗,工作距离长,宽带宽,高 稳定性,高可靠性,小光束发散角,体积小和重量轻等特点。可将光纤端面出射的发散光束变换为平行光束,或者将平行光束会聚并高效率耦合入光纤,是制作多种光学器件的基础器件,因此被广泛应用于光束准直,光束耦合,光隔离器,光衰减器,光开关,环行器, MM,密集波分复用器ES之中。 目录 ?光纤准直器的结构与参数 ?光纤准直器的原理 ?光纤准直器的优点 ?光纤准直器的装配 光纤准直器的结构与参数 ?光纤准直器的结构参数如图5 所示,因光纤头端面的8 度斜角,造成输出光束与准直器轴线存在夹角θ,称为点精度。图6 所示为两准直器的理想耦合情况,二者的输出光场完全重合,其间距为准直器的工作距离Zw。准直器输出高斯光束的束腰距离其端面Zw/2,束腰直径为2ωt,而高斯光束的发散角与其束腰直径成反比关系。到此我们介绍了光纤准直器的三个主要参数:工作距离、点精度和光斑尺寸。 光纤准直器的原理 ?光纤准直器的基本原理是,将光纤端面置于准直透镜的焦点处,使光束得到准直,然后在焦点附近轻微调节光纤端面位置,得到所需工作距离,因此准直器的工作距离与光纤头和透镜的间距L相关。光纤准直器的设计方法是,根据实际需求确定准直器的工作距离,依据高斯光束传输理论,确定光纤头和透镜间距L并计算光斑尺寸,然后依据光线理论计算准直器的点精度。 光纤准直器的优点 ?低插损、高回损、尺寸小 工作距离长、宽带宽
高稳定性、高可靠性 光纤准直器的装配 (1)采用斜端面插针耦合,可大大提高光纤准直器的回波损耗,当斜面倾角为8°01%增 透膜时,光纤准直器的时,光纤准直器的自聚焦透镜后端面镀反射率为0.回波损耗可达 60dB。采用斜端面插针耦合,主要是为了满足器件高回波损耗的求,角度越大,准直器的回波损耗越大。但插针的端面角度越大,准直器的插入损耗就会越大(要求是:插入损耗越小越好,回波损耗越大越好),这和准直器要求的低插入损耗矛盾,对于准直器插入损耗而言,透镜和毛细管是垂直端面最为理想。因此本文采用8°是针对环行器在这种互相制约关系下的一个折中。视应用场合不同其端面斜角可做成6°、8°、9°、11°或任何角度。 (2)透镜与光纤毛细管端面的间隙也主要是和器件高回波损耗有关,为了达到器件高回 波损耗的要求,其间隙一般大于200μm,当间隙大于200μm,器件的回波损耗值近似达到理论上最大值。但透镜和毛细管端面的间隙越大,同时会造成准直器的插入损耗增大,这又是一对矛盾,根据准直器图纸的精度要求,其间隙是0.385mm,这同时能满足高回波损耗的距离要求,也能使其插入损耗达到要求。准直器的插入损耗和回波损耗相比较而言,回波损耗更容易保证,因此在准直器装配时,以其插入损耗为检测依据,就是这个道理。
光纤耦合器C o u p l e r 标准化管理部编码-[99968T-6889628-J68568-1689N]
光纤耦合器又名:分歧器 光纤耦合器(Coupler)是将光讯号从一条光纤中分至多条光纤中的元件,属于光被动元件领域,在电信网路、有线电视网路、用户回路系统、区域网路中都会应用到,与光纤连接器分列被动元件中使用最大项的。 耦合器可分标准耦合器(双分支,单位1×2,亦即将光讯号分成两个功率)、星状/树状耦合器、以及波长多工器(WDM,若波长属高密度分出,即波长间距窄,则属于DWDM),制作方式则有烧结(Fuse)、微式(Micro Optics)、光波导式(Wave Guide)三种,而以烧结式方法生产占多数(约有90%)。烧结方式的制作法,是将两条光纤并在一起烧融拉伸,使核芯聚合一起,以达光耦合作用,而其中最重要的生产设备是融烧机,也是其中的重要步骤,虽然重要步骤部份可由机器代工,但烧结之后,仍须人工作检测封装,因此人工成本约占10~15%左右,再者采用人工检测封装须保品质的一致性,这也是量产时所必须克服的,但技术困难度不若DWDM module及光主动元件高,因此初期想进入光纤产业的厂商,大部分会从切入,毛利则在20~30%。 光耦合器又名:光电隔离器 光耦合器(optical coupler,英文缩写为OC)亦称光电隔离器,简称光耦。光耦合器以光为媒介传输电信号。它对输入、输出电信号有良好的隔离作用,所以,它在各种电路中得到广泛的应用。目前它已成为种类最多、用途最广的光电器件之一。 光耦合器一般由三部分组成:光的发射、光的接收及信号放大。输入的电信号驱动(),使之发出一定波长的光,被光探测器接收而产生光电流,再经过进一步放大后输出。这就完成了电—光—电的转换,从而起到输入、输出、隔离的作用。由于光耦合器输入输出间互相隔离,电信号传输具有单向性等特点,因而具有良好的电绝缘能力和抗干扰能力。又由于光耦合器的输入端属于电流型工作的低阻元件,因而具有很强的共模抑制能力。所以,它在长线传输信息中作为终端隔离元件可以大大提高信噪比。在计算机数字通信及实时控制中作为信号隔离的接口器件,可以大大增加计算机工作的可靠性。 光耦合器的种类达数十种,主要有通用型(又分无基极引线和基极引线两种)、达林顿型、施密特型、高速型、光、维、光敏型(又分单向晶闸管、双向晶闸管)、光敏场效应管型。
设计前的准备 Zemax公司感谢Suss MicroOptics SA公司的Reinhard Voelkel博士提供本文使用到的实验数据。 我们同时提供本文的的日文版本 本文描述了一种商用的光纤耦合器,系统使用SUSS MicroOptics FC-Q-250微透镜阵列来耦合两根康宁(Corning)SMF-28e光纤。如下图所示: 供应商提供的上述元件的参数如下:单模光纤,康宁SMF-28e 数值孔径 0.14纤芯直径8.3μm 模场直径@1.31μm 9.2±0.4μm 微透镜阵列,SUSS MicroOptics SMO39920 基片材料熔融石英基片厚度 0.9mm内部透过率 >0.99透镜直径240μm 透镜节距250μm 曲率半径330μm 圆锥常数(Conic constant) 0数值孔径 0.17附件中的文件single mode coupler.zmx是整个系统的Zemax文件。请注意一下几点: 物面到透镜的距离和透镜到像面的距离设定为0.1mm,是因为这比较接近实际情况。后面经过优化过程时候,这个尺寸还会发生变化;透镜到像面的距离使用了Pick-up solve,以确保和前面的物面到透镜的距离之间相等。既然两组透镜
和光纤之间是完全一致的(在制造公差之内),因而整个系统也就应该是空间反演对称和轴对称的(either way round);两个透镜之间的距离设定为2mm,因为这个是实验中使用的数据。同样地,这个距离后面也将会被严格的优化;系统孔径光阑设定为根据光阑尺寸浮动(float by stop size),而光阑设定在第一个透镜的后表面。这就意味着系统的孔径光阑由透镜的实际孔径决定。因而光纤的模式在这个系统中传输的过程中,就有可能受限于透镜的实际孔径。在这个例子中,光纤的模式要比透镜的实际孔径小很多。当心“数值孔径”的多种不同定义。它有可能指的是边缘光束倾角的正弦值,有可能是光强降低到1/e2时的光束倾角的正弦值(我们将会看到Zemax会在不同的场合使用这两种定义),也有可能定义为光强降到1%峰值强度时光束倾角的正弦值,康宁便使用这种定义。这些非常重要!孔径上定义了高斯切趾(Gaussian apodization),用来产生光束的高斯分布。当前这只是一种近似,后面将会做进一步的精确的计算。透镜孔径的大部分区域是衍射受限的光学质量的,并且被光纤模式照射到的区域是衍射受限的。 使用旁轴高斯光束计算旁轴高斯光束算法是最简单可以用来分析光纤耦合的分析方法。不过,这种方法只能获得对系统性能初步的了解。
光纤准直器原理 曾孝奇 一. 模型 光纤准直器通过透镜能实现将从发散角较大(束腰小)的光束转换为发散角较小(束腰大)的光束,从而以较低损耗耦合进入其他光学器件。在这里,我们将从光纤中的出射光束认为是基模高斯光束;光纤准直器基本模型如下: 图1 光纤准直器原理示意图 其中,i q (i=0,1,2,3)为高斯光束的q 参数,q 参数定义为: ()()() z w i z R z q 211πλ-=, (1) ()z f z z R 2 +=,()2 01??? ? ??+=f z w z w ,λπ2 0w f =; (2) 图1中,i q (i=0,1,2,3)分别表示光纤端面,透镜入射面,透镜出射面,和出射光束的束腰处的q 参数,而01w 和02w 分别表示透镜变换前后的束腰;l 表示光纤端面与透镜间隔,l w 为准直器的设计工作距离。 二. 理论分析 根据ABCD 理论,高斯光束q 参数经透镜变换后, D Cq B Aq q ++= 112, (3) 而且,l q q +=01,2/32w l q q -=,12 010if w i q ==λπ,22 023if w i q ==λ π。
这样,我们可以得到经过透镜后的束腰大小: () () 2 12 01 02Cf D Cl BC AD w w ++-=, (4) 工作距离: ()()()()2 12212 Cf D Cl ACf D Cl B Al l w +++++-=, (5) 方程(5)是关于l 的二次方程,为使得l 有实根,方程(5)的判别式应该不小于零,从而我们可以得到: 1 2 1 2f C ACf BC AD l w --≤ , (6) 方程(6)表示准直器的工作距离有上限,就是一个最大工作距离 ()() 121max /2f C ACf BC AD l w --=。此时,我们得到:C D f l - =1。 分析:不论对于何种透镜,准直器的出射光斑和工作距离都取决于透镜的传输矩阵ABCD ;对于给定的透镜,它们还跟入射光斑大小和光纤端面与透镜间的距离l 有关,也就是说,对于给定的入射光束和给定的透镜,我们可以通过在透镜焦距附近改变l 来实现不同的工作距离。在实际制作准直器当中,我们正是通过这种方法来实现不同的工作距离的。 进一步地,如果我们需要定量计算准直器的出射束腰和工作距离,需要具体知道不同透镜的ABCD 系数。对于G Lens (自聚焦透镜,通常为0.23P ),它的ABCD 矩阵为: () () () () ?? ? ? ???? ?? -=??????L A L A A n L A A n L A D C B A o o cos sin sin 1 cos , (7) 其中,0n 透镜的透镜的轴线折射率,L 为透镜的中心厚度,A 为透镜的聚焦常数。由于G Lens 的ABCD 系数取决于0n ,L 和A ,因而,适当选择这些参数,同样能改变准直器的出射光斑大小和工作距离。 对于 C lens(厚透镜),它的传输矩阵为:
3) 而且, q 1 q 0 l , q 2 q 3 l w /2, q 0 i 2 w01 if 1, q 3 i 2 w 02 2 if 2。 一 . 模型 光纤准直器通过透镜能实现将从发散角较大 (束腰小) 的光束转换为发散角 较小(束腰大)的光束,从而以较低损耗耦合进入其他光学器件。在这里,我们 将从光纤中的出射光束认为是基模高斯光束;光纤准直器基本模型如下: 其中, q i ( i=0,1,2,3 )为高斯光束的 q 参数,q 参数定义为: 图 1 中, q i (i=0,1,2,3 )分别表示光纤端面,透镜入射面,透镜出射面,和出 射光束的束腰处的 q 参数,而w 01和 w 02分别表示透镜变换前后的束腰; l 表示光 纤端面与透镜间隔, l w 为准直器的设计工作距离。 二 . 理论分析 根据 ABCD 理论,高斯光束 q 参数经透镜变换后, Aq 1 B q2 Cq 1 D , 光纤准直器原理 曾孝奇 11 qz Rz i w 2z , 1) 2 , w z w 0 1 2 w 2)
这样,我们可以得到经过透镜后的束腰大小: AD BC w 02 w 01 2 Cl D 2 Cf 1 工作距离: 2 l 2 Al B Cl D ACf 12 , ( 5) l w 2 2 2 , ( 5) w Cl D 2 Cf 1 2 方程( 5)是关于 l 的二次方程,为使得 l 有实根,方程( 5)的判别式应该不小 于零,从而我们可以得到: AD BC 2ACf 1 , w 2 , C 2 f 1 方程( 6)表示准直器的工作距离有上限,就是一个最大工作距离 2D l wmax AD BC 2ACf 1 / C 2 f 1 。此时,我们得到: l f 1 D 。 C 分析:不论对于何 种透镜, 准直器的出射光斑和工作距离都取决于透镜的传 输矩阵 ABCD ;对于给定的透镜,它们还跟入射光斑大小和光纤端面与透镜间的 距离 l 有关, 也就是说,对于给定的入射光束和给定的透镜, 我们可以通过在透 镜焦距附近改变 l 来实现不同的工作距离。 在实际制作准直器当中, 我们正是通 过这种方法来实现不同的工作距离的。 进一步地, 如果我们需要定量计算准直器的出射束腰和工作距离, 需要具体 知道不同透镜的 ABCD 系数。对于 G Lens (自聚焦透镜,通常为 0.23P ),它的 ABCD 矩阵为: 1 cos AL 1 sin AL n o A , ( 7) n o Asin AL cos AL 其中,n 0 透镜的透镜的轴线折射率, L 为透镜的中心厚度, A 为透镜的聚焦常数。 由于G Lens 的ABCD 系数取决于 n 0,L 和 A ,因而,适当选择这些参数,同样能 改变准直器的出射光斑大小和工作距离。 对于 C lens ( 厚透镜 ) ,它的传输矩阵为: 4) 6) C A D B
课程设计任务书 学生姓名:李爽专业班级:电子1301班 指导教师:钟毅工作单位:信息工程学院 题目: 光纤耦合器的耦合比与耦合区长度的关系仿真 初始条件: 具较扎实的光纤理论知识及较强的实践能力;对光纤课题的选择有一定的了解;具备光纤课题的设计能力及基本软件仿真能力;能够正确使用软件进行光纤课题的仿真与分析。 要求完成的主要任务: (1)学习beamprop软件。 (2)光纤耦合器的耦合比与耦合区长度关系的理论分析。 (3)对设计的光纤耦合器进行beamprop软件仿真工作。 (4)完成课程设计报告(应包含原理分析、仿真图及设计总结)。 时间安排: 1.2016年12月24日分班集中,讲解课设具体实施计划与课程设计报告格式的要求; 课设答疑事项。 2.2016年12月25日至2017年1月3日完成资料查阅、设计;完成课程设计报告撰写。 3. 2017年1月4日提交课程设计报告,进行课程设计答辩。 指导教师签名:年月日 系主任(或责任教师)签名:年月日
目录 摘要............................................................................................................................ I Abstract ....................................................................................... 错误!未定义书签。1绪论. (1) 2.设计内容及要求 (2) 2.1设计内容 (2) 2.2设计要求 (2) 3 设计的基本原理 (3) 3.1光纤耦合器简介 (4) 3.2 光纤耦合器分类 (5) 3.3耦合原理 (4) 3.4光纤耦合器与耦合长度的关系 (5) 4 软件仿真 (8) 4.1 beamprop软件介绍 (8) 4.2 对耦合器的仿真 (9) 4.2.1光纤耦合器的绘制 (9) 4.2.2仿真的结果 (11) 5心得体会 (15) 参考文献 (16)
篇一:光纤测量实验报告 光纤测量实验报告 课程名称:光纤测量 实验名称: 耦合器光功率分配比的测量 学院:电子信息工程学院专业:通信与信息系统班级:研1305班 姓名:韩文国 学号:13120011 实验日期:2014年4月22日指导老师:宁提纲、李晶 耦合器光功率分配比的测量 一、实验目的: 1. 理解光纤耦合器的工作原理; 2. 掌握光纤耦合器的用途和使用方法; 3. 掌握光功率计的使用方法。 二、实验装置:ld激光器,1 ×2光纤耦合器,2 ×2光纤耦合器,tl-510型光功率计,光纤跳线若干。 1. ld激光器 半导体激光器是以一定的半导体材料做工作物质而产生激光的器件。.其工作原理是通过一定的激励方式,在半导体物质的能带(导带与价带)之间,或者半导体物质的能带与杂质(受主或施主)能级之间,实现非平衡载流子的粒子数反转,当处于粒子数反转状态的大量电子与空穴复合时,便产生受激发射作用。电注入式半导体激光器,一般是由砷化镓(gaas)、硫化镉(cds)、磷化铟(inp)、硫化锌(zns)等材料制成的半导体面结型二极管,沿正向偏压注入电流进行激励,在结平面区域产生受激发射。本实验用的ld激光器中心频率是1550nm。 2. 光功率计 光功率计(optical power meter )是指用于测量绝对光功率或通过一段光纤的光功率相对损耗的仪器。在光纤系统中,测量光功率是最基本的,非常像电子学中的万用表;在光纤测量中,光功率计是重负荷常用表。通过测量发射端机或光网络的绝对功率,一台光功率计就能够评价光端设备的性能。用光功率计与稳定光源组合使用,则能够测量连接损耗、检验连续性,并帮助评估光纤链路传输质量。 3. 耦合器 光纤耦合器是一种用于传送和分配光信号的光纤无源器件,是光纤系统中使用最多的光无源器件之一,在光纤通信及光纤传感领域占有举足轻重的地位。光纤耦合器一般具有以下几个特点:一是器件由光纤构成,属于全光纤型器件;二是光场的分波与合波主要通过模式耦合来实现;三是光信号传输具有方向性。光纤耦合器是光纤与光纤之间进行可拆卸(活动)连接的器件,它是把光纤的两个端面精密对接起来,以使发射光纤输出的光能量能最大限度地耦合到接收光纤中去,并使其介入光链路从而对系统造成的影响减到最小。对于波导式光纤耦合器,一般是一种具有y型分支的元件,由一根光纤输入的光信号可用它加以等分。 在本实验中所用的1 ×2耦合器光功率分配比理论值为1:9,而2 ×2耦合器光功率分配比理论值为1:1。 三、实验内容: 测量耦合器两输出端的功率,计算功率分配比。 四、实验原理: 2 ×2 光纤耦合器亦称x型光纤耦合器,它是一种应用最为广泛的定向耦合器件。该种耦合器主要依靠倏逝场的作用实现耦合,使两根光纤纤芯相互靠近,可以实现光功率的有效耦合。
光纤连接器的插入损耗 深圳市光波通信有限公司 罗群标 张磊 徐晓林 光纤连接器作为光通信系统中最基本也是最重要的光纤无源器件,其市场需求量越来越大。近年来随着光纤宽带接入系统的发展,光纤链路中光纤连接器(包括其它有源及无源器件上使用的连接头)的使用越来越多,这对光纤连接器的插入损耗的测试准确性提出了越来越高的要求。本文将就影响光纤连接器插入损耗的原因以及如何确保插入损耗测试的准确性及可靠性等问题作以简单的论述。 一. 有关概念 1. 光纤连接器插入损耗(IL )的定义: IL=0 1lg 10P P ? (dB) 其中P1为输出光功率,P0为输入光功率。插入损耗单位为dB 。 2. 光纤连接器插入损耗的测试方法 光纤连接器的插入损耗的测试方法一般有三种:基准法、替代法、标准跳线比对法。 由于在大批量的生产过程中,要求插入损耗的测试必须快速、准确且无破坏性。因此现在的生产厂家大都采用第三种方法,即标准跳线比对法。其测试原理图如下: 4 1 2 3 标准适配器 光功率计 稳定光源 标准测试跳线 被测跳线 当单模光纤尾纤小于50M 、多模光纤尾纤小于10M 时,尾纤自身的损耗可以忽略不计,此时测得的数据即为3端相对于标准连接器的插入损耗,并将此数据提供给客户。当单模光纤尾纤大于50M 、多模光纤尾纤大于10M 时,应在测出的损耗值中减去光纤自身的损耗值。 3. 重复性 重复性是指同一对插头,在同一只适配器中多次插拔之后,其插入损耗的变化范 围。单位用dB 表示。重复性一般应小于0.1dB. 4. 互换性 由于光纤连接器的插入损耗是用标准跳线比对法测出的,其值是一个相对值。所 以在任意对接时,实际的插入损耗值很可能会大于用标准跳线比对法测出的值,而且不同的连接头、不同的适配器,其影响程度也会有所不同。因此就有了互换性这一指标要求。连接头互换性是指不同插头之间,或者不同适配器任意转换后,其插入损耗的变化范围。其一般应小于0.2dB 。如光波公司向客户承诺插入损耗小于0.3dB,互换性小于0.2dB ,则任意对接其插入损耗应小于0.5dB 。 二. 光纤连接器插入损耗的主要因素 1. 光纤结构参数(纤芯直径不同、数值孔径不同、折射率分布不同及其它原因等)的
文章来源: https://www.doczj.com/doc/e43166777.html,/schemes/scheme-27.htm 在自由空间型的光无源器件(如光隔离器、光环形器、光开关等)中,输入和输出光纤端面必须间隔一定距离,以便在光路中插入一些光学元件,从而实现器件功能。从光纤输出的高斯光束(实际为近高斯光束,可以高斯光束近似处理),束腰半径较小而发散角较大,两根光纤之间的直接耦合损耗对其间距极其敏感,光纤准直器扮演这样一种功能,将从光纤输出的光准直为腰斑较大而发散角较小的光束,以增加对轴向间距的容差,如图 4 所示,从图 2(c)(d)亦可看出准直器对轴向容差的改善。 光纤准直器的结构和参数 光纤准直器的结构参数如图 5 所示,因光纤头端面的 8 度斜角,造成输出光束与准直器轴线存在夹角θ,称为点精度。图 6 所示为两准直器的理想耦合情况,二者的输出光场完全重合,其间距为准直器的工作距离Zw。准直器输出高斯光束的束腰距离其端面Zw/2,束腰直径为 2ωt,而高斯光束的发散角与其束腰直径成反比关系。到此我们介绍了光纤准直器的三个主要参数:工作距离、点精度和光斑尺寸。 光纤准直器的设计方法 光纤准直器的基本原理是,将光纤端面置于准直透镜的焦点处,使光束得到准直,然后在焦点附近轻微调节光纤端面位置,得到所需工作距离,因此准直器的工作距离与光纤头和透镜的间距 L相关。光纤准直器的设计方法是,根据实际需求确定准直器的工作距离,依据高斯光束传输理论,确定光纤头和透镜间距 L并计算光斑尺寸,然后依据光线理论计算准直器的点精度。具体设计步骤如下: a) 确定所需工作距离Zw; b) 列出从光纤端面至输出光束束腰位置的近轴光线传输矩阵; 下面以 Grin-Lens准直器为例:
光纤耦合器 光纤耦合器的概述 ?·光纤耦合器的简介 ?·光纤耦合器的分类 ?·光纤耦合器的制作方式 ?·光纤耦合器端口的级联 光纤耦合器的应用 ?·2×2单模光纤耦合器的改进... ?·光纤耦合器中光孤子传输的... ?·可调光子晶体光纤耦合器的制作 光纤耦合器的简介 光纤耦合器是指光讯号通过光纤中分至多条光纤中的元件,属于一种光被动元件,一般 在电信网路、有线电视网路、用户回路系统、区域网路各个领域都会应用到,与光纤连接器 在被动元件中起重大作用,也叫分歧器. 光纤耦合器的分类 光纤耦合器一般分为三类: 标准耦合器:双分支,单位1X2,就是将光讯号未成两个功率 星状/树状耦合器 波长多工器:也称作WDM,一般波长属于高密度分出,即波长间距窄,就是WDM 光纤耦合器的制作方式 光纤耦合器制作方式有烧结(FUSE)、微光学式(MICRO Optics)、光波导式(Wave Guide) 三种.这里介绍下烧结方式,烧结方式占了多数(约有90%),主要的方法是将两条光纤并在一起烧融拉伸,使核芯聚合一起,以达光耦合作用,而其中最重要的生产设备就是融烧机,也是最为重要的步骤,虽然重要步骤部分可由机器代工,但烧结之后,必须人工封装,所以人工成本在10%-15%左右,其次采用人工检测封装必须保证品质一致性,这也是量产时所必须克服的,但技术困难度不若DWDM MODULE及光主动元件高,因此初期想进入光纤产业的厂商,大部 分会从光耦合器切入,毛利则在20~30% 光纤耦合器端口的级联 光纤耦合器端口的级联 由于光纤端口的价格仍然非常昂贵,所以,光纤主要被用于核心交换机和骨干交换机之间连接,或被用于骨干交换机之间的级联.需要注意的是,光纤端口均没有堆叠的能力,只能被用于级联. 1. 光纤跳线的交叉连接
(5) 一. 模型 光纤准直器通过透镜能实现将从发散角较大(束腰小)的光束转换为发散角较小(束腰 大)的光束,从而以较低损耗耦合进入其他光学器件。在这里,我们将从光纤中的出射光束 认为是基模高斯光束;光纤准直器基本模型如下: 图1光纤准直器原理示意图 其中,q i (i=0,1,2,3)为高斯光束的q 参数,q 参数定义为: i i ; (i ) q z R z 1 2 ? w z 丄2 2 2 f “ z 上 w 0 R z z , w z Wo .〔 一 , f 7 (2) z \ f 图1中,q i (i=0,1,2,3)分别表示光纤端面,透镜入射面,透镜出射面,和出射光束的束腰 处的q 参数,而w oi 和W 02分别表示透镜变换前后的束腰;I 表示光纤端面与透镜间隔,l w 为 准直器的设计工作距离。 二. 理论分析 根据ABCD 理论,高斯光束q 参数经透镜变换后, 工作距离: 2 Al B Cl D ACf i 光纤准直器原理 曾孝奇 q 2 Aq i Cq i (3) 2 而且, q i q o 1 , q 2 q 3 I w /2 , q o i if i , q 3 2 ? W 02 i - if 2。 这样,我们可以得到经过透镜后的束腰大小: W 02 (4) W oi
2 严, Cf i Cl D 2 (5)
方程(5)是关于I 的二次方程,为使得I 有实根,方程(5)的判别式应该不小于零,从而 我们可以得到: AD BC 2ACf i C 2f i 方程(6)表示准直器的工作距离有上限,就是一个最大工作距离 I wmax AD BC 2ACf i /C 2f i o 此时,我们得至U : I f 1 -。 C 分析:不论对于何种透镜,准直器的出射光斑和工作距离都取决于透镜的传输矩阵 ABCD ;对于给定的透镜,它们还跟入射光斑大小和光纤端面与透镜间的距离 I 有关,也就 是说,对于 给定的入射光束和给定的透镜,我们可以通过在透镜焦距附近改变 I 来实现不同 的工作距离。在实际制作准直器当中,我们正是通过这种方法来实现不同的工作距离的。 进一步地,如果我们需要定量计算准直器的出射束腰和工作距离,需要具体知道不同透 镜的ABCD 系数。对于G Lens (自聚焦透镜,通常为0.23P ),它的ABCD 矩阵为: A C B cos JAL — si n VAL D n -A , (7) n o J A s in UAL cos JAL 其中,n 。透镜的透镜的轴线折射 率, L 为透镜的中心厚度,、A 为透镜的聚焦常数。由于G Lens 的ABCD 系数取决于n o ,L 和.A ,因而,适当选择这些参数,同样能改变准直器的出射光 斑大小和工作距离。 对于C Iens (厚透镜),它的传输矩阵为: A C 三. 实例分析 本小组采用C lens 已制作的一些准直器, 曲率半径R=1.2mm ,透镜长度L=2.5mm ,C lens 采用SF11材料,在1550nm 处折射率 n=1.744742另外,从单模光纤SMF28出射的光斑半径为 w °1 5 口m 。这样,根据以上理论 分析,我们容易得到出射光在不同位置的光斑大小,并且,我们将理论计算值与 Beamsca n 得到的测量值比较,如下表: (6) 门 o (8) C lens 参数如下:
课程设计任务书 学生姓名:专业班级:电子0902 指导教师:工作单位:信息工程学院 题目:自聚焦光纤的设计及其与标准单模光纤的耦合效率分析 初始条件: (1)掌握光纤技术与应用基本原理 (2)Beamprop软件 (3)计算机 要求完成的主要任务: 设计一个自聚焦光纤,观察其仿真结果,并对耦合效率进行仿真,得到相 应的结果。 时间安排: 2012.6.25做课设具体实施安排和课设报告格式要求说明。 2012.6.25-6.28学习beamprop软件(或Fullwave软件),查阅相关资料, 复习所设计内容的基本理论知识。 2012.6.29-7.5对自聚焦光纤进行设计仿真工作,完成课设报告的撰写。 2012.7.6 提交课程设计报告,进行答辩。 指导教师签名:年月日 系主任(或责任教师)签名:年月日
目录 摘要.........................................................................................................................I Abstract ................................................................................................................. II 绪论 (1) 1 自聚焦光纤简介 (2) 1.1自聚焦光纤 (2) 1.2 自聚焦光纤的特点 (2) 1.3 自聚焦光纤的主要参数 (3) 2 自聚焦光纤的应用 (4) 2.1 聚焦和准直 (4) 2.2 光耦合 (5) 2.3 单透镜成像 (6) 3自聚焦光纤设计仿真 (7) 3.1 Beamprop简介 (7) 3.2 波导绘制及参数设置 (8) 3.3 自聚焦光纤功能仿真 (10) 3.4 自聚焦光纤的耦合效率对比 (11) 4 心得体会 (13) 参考文献 (14)
光纤准直器的应用和发展趋势 发表时间:2019-09-03T16:54:29.790Z 来源:《科学与技术》2019年第07期作者:程义[导读] 本文的研究主要结合了光纤准直器的概念以及具体的设计结构,分析光纤准直器的应用及发展前景。 光库科技股份有限公司广东省珠海市 519080 摘要:光纤通信已经成为了当今社会不可缺少的神经系统,在光纤通信高速发展的今天,光纤准直器被广泛的运用在光通信系统之中。本文的研究主要结合了光纤准直器的概念以及具体的设计结构,分析光纤准直器的应用及发展前景。 关键词:光前准直器;应用;发展趋势;价值引言:光纤准直器是光纤通信系统中重要的器件之一,主要的作用是消耗光源信号的能量,实现信号的连接。光纤准直器具有使用价值的光纤无源器件,在光纤通讯过程中的应用广泛,应用的范围较大。光纤通信目前正在朝向大容量、高速率的方向发展,而光纤准直器正是光纤通信发展的元件之一,因此光纤准直器的重要性日益突出,而光纤准直器也成为了光纤器械中的重要组成器件之一可以有效促进 光纤传感、光纤通讯领域的快速发展。 1.光纤准直器及发展 光纤准直器作为光纤通信系统中的重要组成部分,其在光通信系统中具有广泛的应用。光纤准直器的存在可以促进光纤的耦合,通过压缩发散角实现光的准直平行出射,促使光耦合。光纤准直器将自由空间的激光耦合到单模和多模。光纤准直器的体积小,重量轻,光纤准直器还可以有效的将光源元件端面发射,被广泛的应用在光波分复用器、光隔离器和光环形器等多种器件的应用之中。光纤准直器主要是结合自聚焦透镜(或者Clens)的工作原理而形成的。光纤准直器通过透镜就会转化为平行光线,在激光应用中,高斯光束需要通过各种光学元件,光纤准直器就是发散的高斯光束透过透镜(自聚焦透镜、Clens、非球面透镜等),形成准直的高斯光束。光纤准直器作为基本的光学器件,也是光纤通信系统中重要的元件之一,作用和用途就是对于光纤传输的光准直来提高光束间的耦合性。本文的研究主要是结合光纤准直器的相关理论和具体组成部分,分析光纤准直器的使用价值和应用原理。从发展前景的角度来看,2018年全球应用于光通信的光纤准直器透镜组件的消费值达到3.43亿美元,年增幅19.34%。目前单个透镜光纤准直器组件在整体市场中的占主导地位,准直器透镜广泛应用于光子产品中,但他们这份市场研究专注于应用在光通信器件中的微型准直器透镜组件。光准直器透镜成为了光器件行业增长的一个关键指标。 2.光纤准直器的结构 2.1准直器的结构 光纤准直器的基本结构包括pigtail、透镜和外封。根据pigtail的尾纤数量分为单线光纤准直器、双线光纤准直器、四线光纤准直器、阵列光纤准直器等。根据光纤的类别,光纤准直器可分为普通的光纤准直器、保偏光纤准直器和特种光纤准直器。 保偏双线光纤准直器是应用于光环行器中的基本元件,为了确保准直器中双光纤准直器中两路光均以较高的消光比传输,首先要保证光纤的插芯方向是相互垂直的慢轴方向处于一定的角度范围,具体的结构在制作过程中,需要将两根光纤的位置相互对接进行调节,通过来调节来确保光纤准直器中两根光纤的位置,促使两个两根光纤之间的消光比可以达到一定范围,保证具体的元件插入时损耗,均衡元件插入时损耗的均衡值,为更复杂的器件做出保障。 2.2斜端面透镜设计和理论分析 在实际应用中,由于光纤准直器的连接处存在相应的信息光的透射率,相对来就会产生反射,通常情况下,这种反射光也会满足于相应的传输条件,它们将返回光线,不断地放大,严重影响的种子光源或光纤放大器的稳定工作。近几年来光纤准直器的应用实用系统中端面采用斜角(一般角度设计在8度),这样可以在一定程度上确保光纤传输的条件,同时由于大部分的光线在反射的过程中并不能满足光纤传输的要求。因此,通过光纤准直器的应用,很大程度提高回波的损耗(回波损耗一般都在60dB以上),较好地满足器件的使用价值。 3.光纤准直器的应用 光纤准直器的光纤器械被广泛的应用在光通信和光纤传感之中,而光纤准直器也是作为光纤器件之一,应用在光通信系统上。对于光纤准直器是制作光隔离器、光开光、光环形器、光探测器、光衰器件的主要原件。(光纤准直器在插入损耗和回拨损耗的过程中是通过自透镜的损耗来改善透镜的性能通常情况下可以通过二次离子交换法的应用来加强自聚焦透镜性能的完善,促使光纤准直器器械的使用价值不断提升。此句完成不是光纤准直器的应用,这个是介绍自聚焦透镜) 3.1 小型化光纤准直器 正常的光纤准直器外径在2.8mm左右,mini的光纤准直器外径可以做到1.3-1.4mm。有一类产品是基于光纤熔接玻璃棒的结构,尺寸可以做到更小,甚至等同于光纤的大小,外径可以到125μm或者250μm。从而极大地缩小光学元件的尺寸,使其为未来的5G甚至更快的网速提供基础。 3.2 高功率光纤准直器 一般通信的功率大约在mW级,但是准直器同样可以做到十W、百W甚至几百W。这些高功率的光纤准直器,主要用于工业的切割和激光武器中。 3.3 特殊光斑光纤准直器 特殊光斑准直器分为大光斑准直器和小光斑准直器。大光斑准直器由于其发三角非常小,准直距离非常长,可以用于三维距离探测、远距离通讯等。小光斑准直由于其光斑极小,一般在十几μm甚至几μm,其能量密度非常高,可以用于光纤传感、超快激光、激光切割等。 结束语 综上所述,光纤准直器的工作原理是在结合高斯光束原理基础上进行的,可以有效的促使光纤准直器被运用在光纤通信系统、激光系统和传感系统之中。光纤准直器的应用可以有助于促进光纤系统的完善,有助于光线的长距离接收。我们通过从实用的角度上探讨了光纤准直器的应用,同时结合具体的光纤准直器工作原理,分析了光纤准直器的实用性,目前由于光纤准直器应用得不断发展,所以光纤准直器在光学系统中具有广泛的使用价值。
课程设计任务书 学生姓名:助人为乐专业班级:不计得失 指导教师:一定过工作单位:信息工程学院 题目:自聚焦光纤的设计及其与标准单模光纤的耦合效率分析初始条件: 计算机、beamprop或Fullwave软件 要求完成的主要任务:(包括课程设计工作量及其技术要求,以及说明书撰写等具体要求) 1、课程设计工作量:2周 技术要求: (1)学习beamprop软件。 (2)设计自聚焦光纤的设计及其与标准单模光纤的耦合效率分析 (3)对自聚焦光纤的设计及其与标准单模光纤的耦合进行beamprop软件仿真工作。 3、查阅至少5篇参考文献。按《武汉理工大学课程设计工作规范》要求撰写设计报告书。全文用A4纸打印,图纸应符合绘图规范。 时间安排: 第1天做课设具体实施安排和课设报告格式要求说明。 第2-5天学习beamprop软件,查阅相关资料,复习所设计内容的基本理论知识。 第6-9天对自聚焦光纤的设计进行设计仿真工作,完成课设报告的撰写。 第10天提交课程设计报告,进行答辩。 指导教师签名:年月日 系主任(或责任教师)签名:年月日 目录
摘要........................................................................................................................ I Abstract .................................................................................................................. II 1绪论. (1) 1 自聚焦光纤简介 (2) 1.1自聚焦光纤 (2) 1.2 自聚焦光纤的特点 (2) 1.3 自聚焦光纤的主要参数 (3) 2 自聚焦光纤的应用 (4) 2.1 聚焦和准直 (4) 2.2 光耦合 (5) 2.3 单透镜成像 (6) 3自聚焦光纤设计仿真 (7) 3.1 Beamprop简介 (7) 3.2 波导绘制及参数设置 (8) 3.3 自聚焦光纤功能仿真 (10) 3.4 自聚焦光纤的耦合效率对比 (11) 4 心得体会 (12) 参考文献 (13)