Using Real-time Oscilloscopes To Make Power Electronics Measurements Application Note
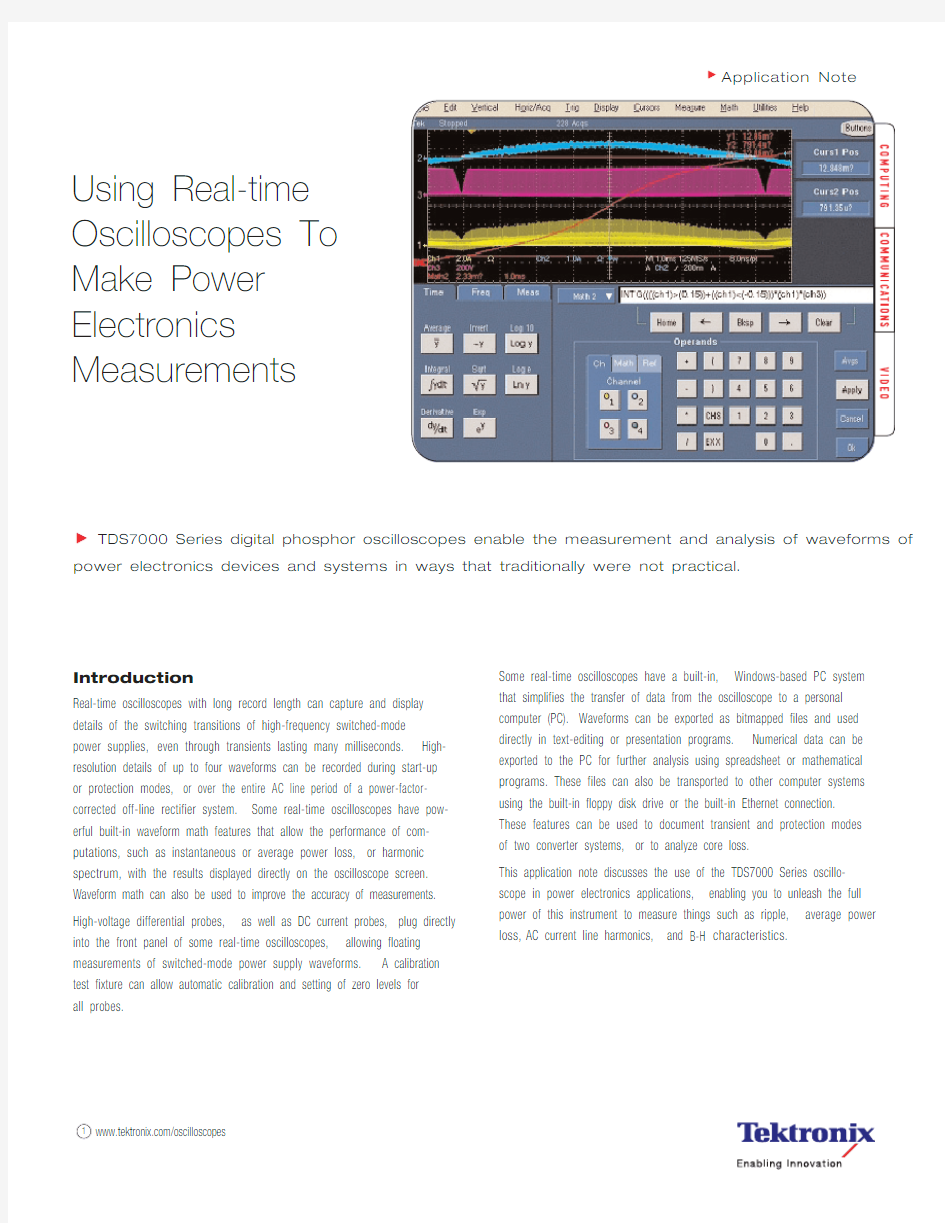
TDS7000 Series digital phosphor oscilloscopes enable the measurement and analysis of waveforms of power electronics devices and systems in ways that traditionally were not practical.
Introduction
Real-time oscilloscopes with long record length can capture and display details of the switching transitions of high-frequency switched-mode power supplies,even through transients lasting many milliseconds.High-resolution details of up to four waveforms can be recorded during start-up or protection modes,or over the entire AC line period of a power-factor-corrected off-line rectifier system.Some real-time oscilloscopes have pow-erful built-in waveform math features that allow the performance of com-putations,such as instantaneous or average power loss,or harmonic spectrum,with the results displayed directly on the oscilloscope screen. Waveform math can also be used to improve the accuracy of measurements. High-voltage differential probes,as well as DC current probes,plug directly into the front panel of some real-time oscilloscopes,allowing floating measurements of switched-mode power supply waveforms.A calibration test fixture can allow automatic calibration and setting of zero levels for all probes.Some real-time oscilloscopes have a built-in,Windows-based PC system that simplifies the transfer of data from the oscilloscope to a personal computer (PC).Waveforms can be exported as bitmapped files and used directly in text-editing or presentation programs.Numerical data can be exported to the PC for further analysis using spreadsheet or mathematical programs.These files can also be transported to other computer systems using the built-in floppy disk drive or the built-in Ethernet connection. These features can be used to document transient and protection modes of two converter systems,or to analyze core loss.
This application note discusses the use of the TDS7000 Series oscillo-scope in power electronics applications,enabling you to unleash the full power of this instrument to measure things such as ripple,average power loss,AC current line harmonics,and B-H characteristics.
Power Electronics Measurements Application Note
Table of Contents
Capturing and Analyzing High-Side. . . . . . . .3 Gate Drive Waveforms
Capturing and Analyzing Protection. . . . . . .5 Modes in a Current-Mode Controlled
DC-DC Converter
Measuring Line Current Harmonics. . . . . . . .6 in a Power-Factor Corrected (PFC)
AC-DC Rectifier
Monitoring Core Saturation and. . . . . . . . . .8 Displaying B-H Characteristics
Measuring Startup and Run Modes. . . . . . . .11 of an Electronic Ballast for
Fluorescent Lamps
Separating Switching Ripple from. . . . . . . . .13 Line Ripple
Measuring Instantaneous and Average. . . . .16 Power in Switching Transitions
Measuring Transistor Losses in a. . . . . . . . .18 PFC Boost Converter
Conclusion. . . . . . . . . . . . . . . . . . . . . . . . . . .22
Power Electronics Measurements
High-Side Gate Drive Waveforms
Application Note
Capturing and Analyzing High-Side
Gate Drive Waveforms
In switching converters that contain transistors that are not referenced to ground,it is difficult to capture the waveforms of the gate driver circuit.For example,Figure 1 illustrates a half-bridge circuit whose high-side MOSFET is not referenced to ground.Measurement of the gate-to-source voltage produced by the high-side driver is needed to verify correct operation.
A standard voltage probe cannot be connected to directly measure the gate-to-source voltage because the ground terminal of the probe is con-nected to earth ground through the oscilloscope and its power supply. "Floating" the oscilloscope by disconnecting its safety ground is an unsafe practice; furthermore,such a practice would yield an incorrect measure-ment here because common-mode capacitors within the oscilloscope power supply would disrupt the operation of the circuit being measured. Two standard voltage probes can be used to measure the gate-to-ground and source-to-ground voltages,respectively.The gate-to-source voltage is then found by subtracting the channels,removing the common-mode sig-nal (i.e.,the source-to-ground voltage).This approach is unsatisfactory when the gate-to-source voltage is much smaller than the supply voltage due to inadequate common-mode rejection and the tendency of the com-mon-mode signal to saturate the input amplifiers.
The TDS7000 Series can be used to capture and analyze high-side gate drive waveforms in a half-bridge circuit by measuring high-frequency floating voltages using the P5205 high-voltage differential probe.The
P5202 probe allows safe,highly accurate measurements of floating voltage signals.It also enables clear and accurate measurement of high-speed transitions while providing excellent common-mode rejection.Its high input impedance and low capacitance at both inputs allows it to safely measure floating voltages in switching power supplies (up to a maximum of 1300 V between the inputs for the P5205 probe).
Setup
Before taking any measurements,the TCP202 current probe must be cali-brated using the probe calibration fixture.In addition,the P5205 high-volt-age differential probe output must be adjusted to zero using the procedure given in its instruction manual.
1.Set P5205 high-voltage differential probe to measure the high-side gate-to-source voltage waveform (see Figure 1).
2.Set TCP202 current probe to measure the drain current of the same device.
3.From the "Horiz/Acq" menu,select "Horizontal/Acquisition".
4.Select "Acquisition" and set as necessary to "Sample" or "Peak Detect" (see Figure 2).
5.Select "Horizontal" and set the "Sample Rate" to 50 MS/s.
6.Set trigger as "Auto Trigger" and press the "EDGE" and "POS" slope (rising edge) buttons on the oscilloscope front panel.
Figure 1.Half-bridge circuit.
Figure 2 illustrates the measured waveforms.Channel 1 (yellow trace) dis-plays the MOSFET drain current at 2 A per division.Channel 2 (blue trace)displays the high-side gate-to-source waveform at 5 V per division.For these measurements,the supply voltage was approximately 200 V.The attenuation range of the probe was set on 50X for better signal resolution.The audible overrange was kept "ON" and the bandwidth set to "FULL".Figure 2a shows that the maximum gate-to-source voltage is 14.75 V and minimum is – 1.3 V,which is sufficient to ensure proper turn-on and turn-off of the device.These waveforms employ the default sample mode in which the waveforms are sampled at the selected rate.
As a further check of the gate drive waveform,the peak detect mode can be employed,as in Figure 2b.In this mode,the waveforms are sampled at a 2.5 GS/s sample rate,and the extreme (maximum and minimum) val-ues are alternately stored.For example,at the 50 MS/s rate selected in Figure 2b,waveform data is stored every 20 ns.Each stored data point represents the maximum or minimum value of the (2.5 GS/s) / (50 MS/s)
= 50 samples taken over the 20 ns period.The resulting display provides an additional check on whether noise or ringing is being missed in the sampling process.Figure 2b illustrates that the gate drive waveform appears to be sufficient to properly switch the MOSFET.The sample,peak detect,and other acquisition modes are further discussed in the section titled Separating Switching Ripple from Line Ripple .
To save the measured waveforms in a file usable by PC applications,use the following export commands under the File menu.The Select for Export command allows you to specify whether to export numerical waveform and measurement data,or bitmapped images of the graticule or entire screen area.The Export Setup command allows you to choose the file format;bitmap (.bmp) and jpeg (.jpg) formats are available for bitmapped images,while .txt,.csv,and .dat formats are available to export numerical data to applications including word processors,spreadsheets (Excel,Lotus 1-2-3,Quattro Pro),and mathematical applications (MATLAB,Mathcad).Finally,the Export command allows you to save the file to disk.
Power Electronics Measurements
High-Side Gate Drive Waveforms
Application Note
Figure 2b.Measured signals using peak detect mode.Channel 1 (yellow trace):drain current,2 A/div.Channel 2 (blue trace):gate-to-source voltage,
5 V/div.
Figure 2a.Measured signals using sample mode.Channel 1 (yellow
trace):drain current,2 A/div.Channel 2 (blue trace):gate-to-source voltage,5 V/div.
Power Electronics Measurements Protection Modes in a Current-Mode Controlled DC-DC Converter
Application Note
Measuring Line Current Harmonics in a Power-Factor Corrected (PFC)AC-DC Rectifier
Equipped with decimal record length,Fast Fourier Transform (FFT) math and automatic measurements,the TDS7000 Series is a superior tool to measure AC line current harmonics in a power-factor corrected (PFC) AC-DC switched-mode rectifier.
The oscilloscope’s math capabilities include spectral analysis of the wave-form in both the time and the frequency domains.The frequency domain controls resemble those of traditional spectrum analyzers,with the ability to set the center frequency,span and resolution bandwidth.The oscillo-scope uses the FFT function to plot the magnitude and phase spectra of a measured waveform.Here we plot the harmonic magnitudes of the meas-ured AC line current waveform.
Setup
The TCP202 current probe must be calibrated using the probe calibration fixture before taking any measurements.
1.Set the TCP202 current probe to measure the input line current.
Accuracy of the measurement is maximized when the vertical scale is adjusted so that the waveform fills the screen without saturating the input amplifier and A/D converter.See Step 4 of the section titled Separating Switching Ripple from Line Ripple for a way to adjust the vertical scale using peak detect mode.
2.From the "Math" menu,select "Math Setup" and then "Spectral
Analysis Setup" (see Figure 4).
3.In "Window Type",select "Black Harris".There are 8 different spectral
analyzer window types.Each window type affects the shape of the spectral analyzer response in the frequency domain.Therefore,this selection is made based solely on the characteristic of each window type.
4.Set "Frequency Span" to 1 kHz.
5.
Set "Center Frequency" to 500 Hz.This will cause the horizontal scale to become 100 Hz/div.6.Select "Mag" and set to "Linear".
7.Set the Math 1 function as SpectralMag(Ch1),as follows:from the
"Create" palate,click on "Magnitude" and then "Ch1".8.From the "Horiz/Acq" menu,select "Horizontal/Acquisition".9.Select "Acquisition" and set to "Hi Res".
10.Set trigger as "Auto Trigger" and press the "EDGE" and "POS" slope
(rising edge) buttons on the front panel.11.Click "Apply".
Power Electronics Measurements
Line Current Harmonics in a PFC AC-DC Rectifier
Application Note
Figure 4.
Spectral analysis setup window.
Power Electronics Measurements Line Current Harmonics in a PFC AC-DC Rectifier
Application Note
Power Electronics Measurements Core Saturation and B-H Characteristics
Application Note
Power Electronics Measurements Core Saturation and B-H Characteristics
Application Note
Power Electronics Measurements Core Saturation and B-H Characteristics
Application Note
Power Electronics Measurements Startup and Run Modes of an Electronic Ballast
Application Note
Power Electronics Measurements Startup and Run Modes of an Electronic Ballast Application Note
Power Electronics Measurements Separating Switching Ripple from Line Ripple
Application Note
Separating Switching Ripple from
Line Ripple
In linear power supplies,the measurement of twice-line-frequency (120 Hz) output ripple is relatively easy,since one can trigger the oscilloscope on the line voltage and the oscilloscope then displays the line frequency rip-ple.But in switched-mode power supplies,the output signal is dominated by switching ripple of hundreds of kHz,as well as other noise.It becomes difficult to measure the component of output voltage ripple that is induced by AC line rectification ripple.Similar issues arise when measuring the input current waveform quality in a power factor corrected off-line rectifier. The TDS7000 Series’ various acquisition modes – sample,envelope,aver-age,high-resolution (Hi Res) and peak detect – make it the ideal tool to determine the quality of the DC output voltage of a switching converter, specifically the determination of output noise and switching ripple.This task is accomplished by separating switching ripple from line ripple to dis-play the low-frequency components of a waveform containing substantial switching harmonics.
Sample mode is the default mode in which the oscilloscope displays sam-ples of the waveforms with no additional processing.Envelope and average modes accumulate data over multiple sweeps.
High-resolution (Hi Res) mode performs a fast averaging of the waveform that can be used to filter out noise and switching ripple,and also improves the effective resolution of the analog-to-digital conversion.In the Hi Res mode,the TDS7000 Series oscilloscopes sample the waveform at a
2.5 GS/s rate.Waveform data points are saved at a lower sample rate,set in the horizontal acquisition window.Each record data point is generated by averaging all samples taken during that acquisition interval.Key advan-tages of the Hi Res mode are to increase resolution regardless of the input signal,and to average the waveforms over the acquisition interval.The effective resolution is given by Equation 13 (see the section titled Measurement of Transistor Losses in a PFC Boost Converter),up to a max-imum of 16-bit resolution.The averaging process effectively low-pass fil-ters the waveform,with cutoff frequency dependent on the horizontal sam-ple rate.For this measurement,the averaging property is exploited to attenuate the switching ripple by selecting a sample rate slower than the switching frequency.The oscilloscope then displays the low-frequency AC line ripple.Peak detect mode is similar to Hi Res mode,but records the data points that are the extreme values of the waveform,including noise and switching ripple – in this case,2.5 GS/s samples (maximum and minimum values are alternately stored) – enabling the oscilloscope to record peak noise levels. This mode can also be used to adjust the channel vertical scales to avoid saturation of the input amplifiers and analog-to-digital converters (ADCs).
Set Up
Before taking any measurements,the TCP202 current probe must be cali-brated using the probe calibration fixture.In addition,the P5205 high-volt-age differential probe output must be adjusted to zero using the procedure given in its instruction manual.
1.Connect the P5205 voltage probe to measure the output voltage with AC coupling.
2.Connect the TCP202 current probe to measure the input current of the converter.
3.From the "Horiz/Acq" menu,select "Horizontal/Acquisition".
4.Select "Acquisition" and set to "Peak Detect" (see Figure 12).For maxi-mum resolution of the analog-to-digital conversion,the vertical scale should be set to the highest sensitivity possible.However,the input channel ADCs have a linear range of 10.24 divisions (±
5.12 divisions from the centerline of the display,or 1.12 divisions above and below the top and bottom of the display respectively).To avoid saturation,
the waveform display in peak detect mode should remain within these limits.
5.Select the Horizontal menu and set the "Sample Rate" to a value
that is sufficiently less than the switching frequency,and much greater than the frequency of the (100 Hz or 120 Hz) rectification ripple (see Figure 14).
6.Select "Acquisition" and set to "Hi Res" (see Figure 15).
7.Set the trigger mode to "Auto Trigger" and press the "EDGE" and "POS" slope (rising edge) buttons on the oscilloscope front panel.
8.If desired,the waveform can now be examined with greater magnifica-tion using the zoom function.
In Figures 14 to 17,the uppermost waveform (Channel 2,blue trace) is the converter output ripple voltage,AC coupled at 100 mV per division.Channel 1 (yellow trace) is the 60 Hz input current waveform,at 1 A per division.Figure 14 shows the results obtained using the peak detect mode,and Figure 15 illustrates the same waveforms measured with Hi
Res mode.The same waveforms measured with the sampled and averaged modes are illustrated in Figures 16 and 17,respectively.Figure 18 demon-strates the use of the zoom function to display details of the Hi Res wave-form.The switching frequency of the converter is approximately 60 kHz.
Power Electronics Measurements
Separating Switching Ripple from Line Ripple
Application Note
Figure 13.
Configuring horizontal acquisition.
Figure 12.
Configuring the peak detect mode.Figure 15.High-resolution mode.Channel 1 (yellow trace):input line current,1 A/div at 60 Hz.Channel 2 (blue trace):output voltage ripple,
100 mV/div.
Figure 14.Peak detect mode.Channel 1 (yellow trace):input line current,1 A/div at 60 Hz.Channel 2 (blue trace):output voltage ripple,100 mV/div.Note the blue trace is adjusted to get maximum output ripple on the screen without saturating the oscilloscope.
Power Electronics Measurements
Separating Switching Ripple from Line Ripple
Application Note
Figure 17.Average mode.Channel 1 (yellow trace):input line current,1 A/div at 60 Hz.Channel 2 (blue trace):output voltage ripple,100 mV/div.
Figure 16.Sample mode.Channel 1 (yellow trace):input line current,1 A/div at 60 Hz.Channel 2 (blue trace):output voltage ripple,100 mV/div.
Power Electronics Measurements Instantaneous and Average Power in Switching Transitions Application Note
Power Electronics Measurements Instantaneous and Average Power in Switching Transitions
Application Note
Power Electronics Measurements Transistor Losses in a PFC Boost Converter Application Note
Power Electronics Measurements Transistor Losses in a PFC Boost Converter
Application Note
Power Electronics Measurements Transistor Losses in a PFC Boost Converter Application Note