
图表及漫画类作文
一写作模板
(1) 组图写作模板
The story took place 时间和地点.
事件起因(要点一,图片一的内容). 事件的发展(要点二、三……,图片二、三……的内容). 事件结局(最后一个要点,最后一张图片的内容)
From the story, I feel自己的看法或感想.
(2)对比图写作模板
Great changes have taken place in地点since时间.
In the past, 描述过去的情景(图片一的内容). But now our village/school/city is taking on a new look. 描述现在的情景(图片二的内容).
There are many reasons for the great changes. First, 变化的第一个理由. Second, 变化的第二个理由. Third, 变化的第三个理由…Last but not least, 变化的最后一个理由.
I think自己的感想.
(3)单张图写作模板
As can be seen in the picture, 图画内容. The picture tells us概括图片大意.
The implied meaning of this picture should be taken into consideration seriously. To begin with, 揭示涵义/原因/结果1. Second, 揭示涵义/原因/结果2.
In my opinion/ As for me, we should take some measures to deal with the problem. First , we should具体措施1. Second, we must具体措施2. Only in this way can we solve the problem of 图画内容.
(4)图表作文模板
As is shown/ indicated/ illustrated by the figure/ percentage in the table/ graph/ chart/ pie, _____________ (作文题目的议题)has been on rise/ decline, significantly/ dramatically/steadily rising/ decreasing from ________ to _______. From the sharp/ marked decline/rise in the chart, it goes without saying that ____________________.
There are at least two reasons accounting for _______________. On the one hand, ______________. On the other hand, ___________ is due to the fact that ______________. In
addition, ___________ is responsible for _______________. Maybe there are some other reasons to show________________. But it is generally believed that the above mentioned reasons are commonly convincing.
As far as I am concerned, I hold the point of view that______________________.
二范文
(1)组图
组图通常呈现一件事情发生的始末,考生要根据几幅图的先后顺序介绍事情的全过程。有时需要发表考生个人的感想。写作时,要根据主题的需要来概括每幅图的写作要点,一定要分清主要内容和次要内容,必写内容和非必写内容。
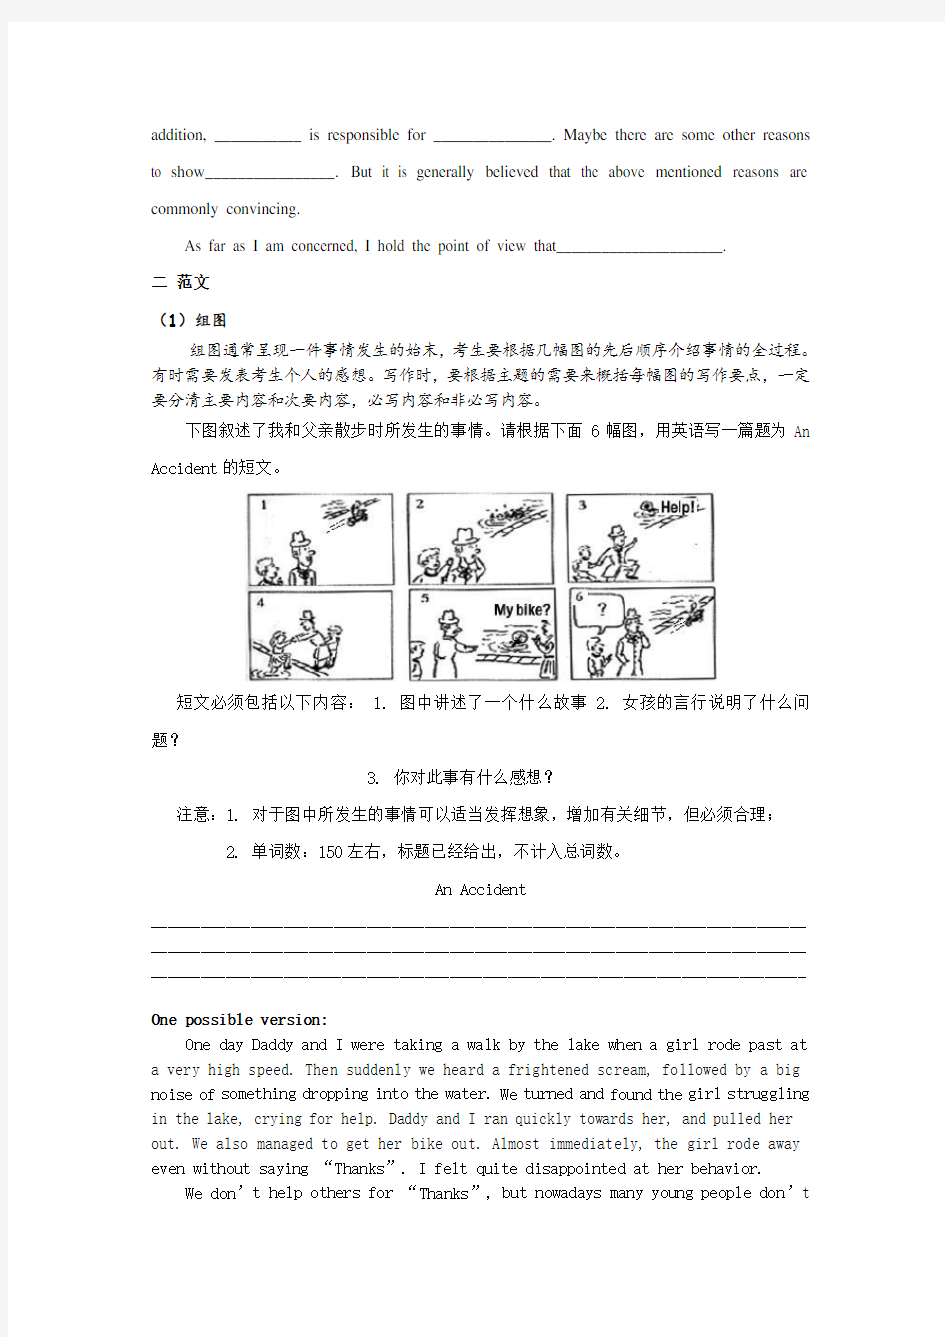
下图叙述了我和父亲散步时所发生的事情。请根据下面6幅图,用英语写一篇题为An Accident的短文。
短文必须包括以下内容: 1. 图中讲述了一个什么故事 2. 女孩的言行说明了什么问题?
3. 你对此事有什么感想?
注意:1. 对于图中所发生的事情可以适当发挥想象,增加有关细节,但必须合理;
2. 单词数:150左右,标题已经给出,不计入总词数。
An Accident
_______________________________________________________________________________ _______________________________________________________________________________ _______________________________________________________________________________
One possible version:
One day Daddy and I were taking a walk by the lake when a girl rode past at a very high speed. Then suddenly we heard a frightened scream, followed by a big noise of something dropping into the water. We turned and found the girl struggling in the lake, crying for help. Daddy and I ran quickly towards her, and pulled her out. We also managed to get her bike out. Almost immediately, the girl rode away even without saying “Thanks”. I felt quite disappointed at her behavior.
We don’t help others for “Thanks”, but nowadays many young people don’t
know how to be polite. What a pity it is for our society and for our civilization. At the same time, I remembered stories where people offered their hand but were later accused of causing the accidents. How lucky we were. After all, we escaped being included in such stories. (151words)
(2)对比图
对比图通常是提供两到三张图画,考生应对图画进行全面而细致的研究,除了掌握每一幅图画的信息,还应该对图画之间的相应联系或彼此之间的差异有所理解,从而在整体上把握图画所传达的信息。这种命题形式主要是考查考生描写和议论的表达能力。
为纪念汶川大地震三周年,某英文报发起关于灾区新貌的征文活动。请根据以下图片提示,以“Great Changes”为题,用英语写一篇短文应征。内容要点如下
1. 某中学灾后三年来的变化,如教学与活动场所,以及师生精神面貌等;
2. 发生变化的原因;
3. 你的感想。
注意:
1. 短文标题与开头已给出,不计入总词数;
2. 可根据图片提示适当发挥;
3. 词数:150左右。
Great Changes
I am deeply impressed by the great changes that have taken place in the school over the past three years.
_______________________________________________________________________________ _______________________________________________________________________________ _______________________________________________________________________________ One possible version:
I am deeply impressed by the great changes that have taken place in the school over the past three years.
On May 12, 2008, a severe earthquake destroyed almost everything in the school, leaving badly-damaged buildings. It is now, however, taking on a new look. Tall buildings have been put up, including classroom and laboratory buildings, and a library. There is also a newly-built standard playground. In the new environment, teachers and students are living happily and
working hard. It is really amazing that the once-ruined place has now been turned into a beautiful school, full of life.
Obviously, without the help of the whole society, there would be no new school today. It is love and concern that have brought about the great changes. Many hands make light work. We can work wonders if we unite as a family, caring for each other and helping those in need. Union is strength.
(3)单张图画
单张图画通常是提供一幅图画(一般是漫画)并配以一定的文字提示。考生要仔细观察图画所传达的表面信息,结合文字提示,还要能深刻挖掘该幅图画所表达的深层含义,即现实意义。这种命题形式主要是考查考生说明和议论的表达能力。
下面这幅照片展现了女儿为回家的妈妈拿包的情景。请根据你对这幅照片的理解用英语写一篇短文。
你的短文应包含以下内容:
1.描述照片内容,如情景、人物、动作,等等;
2.结合自身实际,谈谈你的感想;
3.举例说明你能为家长减负做些什么。
注意:
1. 可参照图中文字及下面文章开头所给提示,作必要的发挥想象。
2. 词数150左右。开头已经写好,不计入总词数。
3. 作文中不得提及考生所在学校和本人姓名。
The burden of students has been a hot topic for years, but the load of parents has received little attention, especially fro m their own children.
_______________________________________________________________________________ _______________________________________________________________________________ _______________________________________________________________________________ _______________________________________________________________________________ ______________________________________________________________________________ The burden of students has been a hot topic for years, but the load of parents has received
little attention, especially from their own children.
The picture shows us a touching moment when a little girl comes to greet her working mom. Realizing her mom must be very tired after a day's work, the girl helps to remove the bag from her shoulder. In response, the mom kneels down to show how happy and thankful she feels.
All this reminds me of my mother who has been doing whatever she could to let me have the best. But, totally engaged in my own study, I seldom pay attention to what mother needs and feels, and always think studying well is the only thing I could do in return. Now I know I can do my bit to help with the everyday washing, bedroom cleaning, or at least prepare breakfast myself, so as to share mother's daily burden. The picture convinces me it is even more important to be a good daughter than a “good” student.
(4)表格
下表是对某中学高三一班50个学生健康问题的调查表。请根据表格内容,综述学生当前存在的健康问题,并就中学生如何保持身心健康提出自己的建议。
问题类型学习焦虑逆反心理缺乏交往睡眠不足缺乏锻炼视力不佳
人数35 20 15 40 25 35
比例70%40%30%80%50%70%词数要求: 150左右
______________________________________________________________________________ ______________________________________________________________________________ ______________________________________________________________________________ One possible version:
As is apparently shown in the chart above, many middle school students have problems both physically and mentally, with 70% of students having learning anxieties as well as bad eyesight, and a larger percentage lacking sleep. Coming next is the lack of physical exercise. 40% of the students surveyed won't obey their parents or teachers. Still fewer claimed not to have enough communication with others.
So far as 1 am concerned, we students should balance our physical exercise and studies. Just like a saying goes:" All work but no play makes Jack a dull boy," without a sound body one cannot achieve anything; however, too much attention has been paid only to studies. Therefore, I suggest we be given less homework and more time for out-of--classroom activities to solve all the problems. Only in this way can we lead a healthy life.
假设你是张亮,上周你们班以“谁是你的偶像”为题,在2600名学生中进行了一次调查。以下是调查数据:
1.调查时间、问题以及调查对象
2.男女生在选择偶像方面的差异以及产生以上现象的原因
3.你的偶像及理由。(字数150左右)
(5)曲线图
根据下面曲线图,以Car Explosion in China为题,描述我国近10年来私人拥有小汽车情况,说明人们生活的水平的变化和你的看法。词数:150左右。
One possible version:
Car Explosion in China
As is vividly described in the table above, great changes in car ownership have taken place in China over the past decade.The number of private cars has accordingly increased nearly 7 times from more than 2 million in 1996 to over 14 million in 2006. What's the reason?
There are two main factors for these changes. To begin with, development in economy plays a vital role in these years. The higher incomes result in Chinese people's owning private cars. What's more, in modern society, time means money, many Chinese need a car to do business on time.
From my point of view, however, the car explosion will constantly increase year by year. A large number of social problems such as traffic jams, among other things, are turning up nearly in every city in China.
Homework:
下面这幅图表是中国某城市在过去三十年间人们出行方式的情况统计,请根据你对这幅图表的理解用英语写一篇短文.
短文应包括以下内容:
1.根据所给图表描述人们出行方式的变化趋势;
2. 分析导致图表中人们出行方式变化的可能原因;
3.从环保和健康等角度谈谈你自己的看法.(至少两点)
(6)柱状图
随着电脑普及率的提高,老师、家长和学生对字迹的重视程度降低了。据一项调查显示,有85.8%的中学生说自己的字迹不好看,而他们又不想改善字迹,其理由有很大差别。
请根据下图写一篇150词左右的英文短文,说明该现象并发表自己的看法。
___________________________________________________________________________ ___________________________________________________________________________ ___________________________________________________________________________ Nowadays, with the growing popularity of computers,teachers,students and their parents are paying less and less attention to their handwriting.
According to a recent survey, about 85.8 percent of middle school students think that their handwriting is poor. Yet for various reasons, many students don't want to improve their handwriting. 51.5 percent of the students think that they can just use a computer, so there is no need to waste time improving their handwriting, and 32.3 percent believe that they are so busy with the study that they do not have time to practice. 10.9 percent think that practicing handwriting is useless.
As the saying goes, writing style shows the man. Beautiful and neat handwriting is beneficial, especially for middle school students. Therefore, in my opinion, more emphasis should be placed on this aspect in future.
Homework:
星期一, 我们开了个班会讨论“上大学是高中生唯一的出路吗?”以下图表是讨论结果.
Is it the only way out to go to college? 写作内容:
根据以上图表数据, 写一篇短文, 包括以下内容;
1. 增长知识,提高素养(quality), 利于择业
2. 成功的路不只一条.
3. 学费(tuition)高,就业难.
4. 你的观点及原因.
(7)饼状图
以下两幅图是关于学生零花钱的问题。请你用英语写一篇短文,谈谈你的理
解。短文必须包括以下内容:1. 图画反映了什么? 2.你对其原因的分析。 3.
你的建议。
注意:1、必须包括所有要点,适当发挥,不要简单翻译。
2、词数150左右,开头已给出,不计入总数。
3、文中不得提及你所在学校与本人姓名。
With the development of our modern society, children have more and more pocket
money, which is of public concern ___________________________________________________________________________
___________________________________________________________________________
___________________________________________________________________________
___________________________________________________________________________
___________________________________________________________________________
__________________________________________________________________________
One possible version:
With the development of our modern society, children have more and more pocket money, which is of public concern. As is seen from the pictures, nearly sixty percent of the students take 50-100yuan or more from their parents every week while forty percent get less than 10yuan. Although four in ten parents refuse to give the money when thinking it’s not reasonable, half of them seldom refuse their children’s request and one in ten cares little about how the money is spent. Therefore, some students with a large amount of pocket money may not know how to use it appropriately. Just as the picture shows, to show off how rich he is, one student treats his classmates to dinner, asking them to order whatever they like.
I think the main reason for this is that children aren’t taught the skills to manage money. So I have some suggestions to make. First, parents should help kids learn money-management skills such as spending with a plan. Besides, more opportunities should be offered to kids, helping them know earning money is hard work. Only in this way will kids treasure the money.
大学英语四级考试图表作文 1、图形种类及概述法: 饼图:pie chart 直方图或柱形图:bar chart / histogram 表格图:table 趋势曲线图:line chart / curve diagram 泛指一份数据图表:a data graph/chart/diagram/illustration/table 2、图表中的数据(Data )具体表达法 数据(Data )在某一个时间段固定不变:fixed in time 在一系列的时间段中转变:changes over time 3. 持续变化的data 在不同情况下: 增加:increase / raise / rise / go up 减少:shrink/decrease / drop / fall … 波动:fluctuate / undulate / wave 稳定:remain stable / stabilize / level off 4. 最常用的两种表达法: 动词+副词形式(Verb+Adverb form)形容词+名词形式(Adjective+Noun form ) 5. 图表常用动词:show 、describe 、illustrate 、can be seen from、clear 、apparent 、reveal 、represent 、demonstrate 6. 图表常用名词:figure 、statistic 、number 、percentage 、proportion 7、表示数据变化的单词或者词组 rapid/rapidly 迅速的,飞快的, dramatic/dramatically 戏剧
图表类英语作文范文英语作文模板(图表类的)这里很全 一、图表类作文常用的单词、短语和句型 1.表示数据变化的单词或短语 in the case of (在……的情况下) in terms of (在……方面) increase / raise / rise / go up(增加) decrease / grow down / drop / fall (减少) increased by (增长了) increased to (增长到) the number sharply goes up to(数字急剧上升至)
significant(重大的),steady(平稳的),gradual(逐渐的),slow(慢慢的),stable(稳定的),rapid(快速的)…… 2. 表示从图表得知的信息的句型 The table / chart / graph shows that...(这个图表告诉我们……) Aording to the table / chart /graph, we can see that...(根据图表,我们可以看出……) It can be concluded from the graph that...(从图表中可以得出……) The table shows the changes in the number of...over the period from...to...(该表格描述了在……期间……数量的变化) 二、图表类作文的模式
图表类作文中的图表主要有以下形式:柱形图类(chart)、圆饼图类(pie chart)、曲线图类(line chart)、表格类(table)。写文章时,首先要对图表加以描述,而后引出主题加以讨论,最后得出结论,也就是按照描述图表—解释原因—下结论的步骤来写。切忌对图表不作交代就直接谈论主题。 1.表格类作文的模式 表格类作文一般可以分为三段:第一段对表格中的数据进行描述,只要抓住变化规律即可,切忌一一列举数据;第二段说明变化的原因;第三段得出结论。即: (1) Studying the table carefully, we can see...(仔细研读表格,我们可以看出……) (2) In my opinion, the reasons why...are as follows. Firstly...Secondly...Thirdly...(在我看来,为什么……的原因在于以下几点:第一……第二……第三……)
考试时间主题或题目题材体裁命题形式写作类型 校园生活议论文图表作文观点论证型2015.6 Mobile phone and study internet 社会生活议论文图表作文现象解释、 问题解决型 社会热点议论文图表作文现象解释型Parents’role in children’s growth 校园生活夹叙夹议文字描述解释型2014.12 A classmate in college 校园生活夹叙夹议文字描述解释型 A course in college 校园生活夹叙夹议文字描述解释型 A campus activity in college 校园生活说明文文字现象解释型2014.6 Interesting place on campus 考试时间主题或题目题材体裁命题形式写作类型 社会生活议论文图表文字观点论证型2013.12 Internet and study Mobile phone 社会生活议论文图表文字问题解决型 社会生活议论文图表文字对比选择型2013.6 Comparison of doing small things and great things 2012.12 Education pays 校园生活议论文图表文字现象解释型 社会生活议论文提纲式文字问题解决型2012.6 On excessive packaging 校园生活议论文提纲式文字现象解释型2011.12 Nothing succeeds without a strong will 社会生活议论文提纲式文字现象解释型2011.6 Online shopping
2015.6 范文:Writing:家长角色 There are several possible reasons accountable for this phenomenon(中心句). To begin with, family in growing numbers has only one child; therefore, parents oftentimes focus all their attentions on that child and exert much pressure on him or her(原因一). Moreover, numerous parents intend to realize their unfulfilled dreams by letting their children learn what they failed to learn and apply for the college by which they failed to be accepted, because they have become richer and they believe that they have the power to make what they wanted and want come true now(原因二). For instance, my uncle used to be a poor man and his dream that one day he would become a violinist was broken because of lack of money. But he made a fortune by selling coals, and then forced his son, my younger brother to practice playing violin. My brother was a huge fan of sports, but now he has to play violin everyday unwillingly and ofter quarrels with their parents(举例:原来-然后-结局). To sum up, it is unreasonable for parents to control their children’s life(总结句). In order to help them grow happily and healthily, parents are supposed to communicate with their kids about what they are really interested in(建议一,目的句型). Meanwhile, it is about time that parents let their kids make their own choices(建议二,“是时候”句型). Only in these ways will children grow in a psychologically happy environment and realize their own dreams 2014.12 t he Most Impressive Campus Activity Every university offers numerous kinds of activities to enr ich students’ extracurricular life. As one of the young college students, I have benefited a lot from all of these well-organized activities, but the one impressing me most is the debate competition which I took part in last year.
英语四级写作万能:图表型作文精编版 MQS system office room 【MQS16H-TTMS2A-MQSS8Q8-MQSH16898】
英语四级写作万能模板:图表型作文 图表型作文 此类作文要求考生从提示性文字或图表、图画入手,解释提示性文字、图表、图画反映出的问题,提出问题的危害性或解决这一问题的紧迫性;然后对问题展开分析,提出解决问题的方案或应对措施;最后一段要求考生表明自己的态度、做法等。 a.影响分析型关键句式 The chart / graph/ table/ picture describes that the figure declines/ falls smoothly/ markedly. It indicates that…图表显示数字下降平缓,这表明…. There may be a combination of factors which contribute to / are responsible for …可能是好几个因素造成的结果。 There may be several possible reasons to this phenomenon, which will be demonstrated as follows. 可能有几个原因导致了我们下面所要阐述的现象。 The significant effects of this phenomenon are undeniable, which can be concluded as the following aspects.这一现象的重大影响是不可忽略的,可大致归结为以下几个方面 On one hand, …; On the other hand,…一方面,…;另一方面,… 现象阐释类作文框架 As is shown in the graph above, we can see clearly that great changes have taken place in … from…to… The first … years saw… The last … years witnessed … What are the reasons for the? On my standpoint, there are several as follows. First of all, (______). What is more, (______).Last but not the least,(______). The significant effects of this phenomenon are undeniable, which can be concluded as the following aspects. On one hand, …; On the other hand,… 76 words b.问题解决型关键句式 It is important that effective actions should be taken to prevent the situation. 采取有效措施防止这种情况的发生很重要。
图表分析作文1 As is clearly shown in the table/ figure/ graph / chart, 图表总体描述between 年代and 年代. Especially, 突出的数据变化. There are three reasons for 具体表示急剧上升、下降或特殊现象的词. To begin with, 原因一. In addition / Moreover, 原因二. For example, 具体例证. Last but no least, 原因三. In short,总结上文. As far as I am concerned, / For my part, / As for me,作者自己的观点. On the one hand, 理由一. On the other hand, 理由二. In brief,总结上文. 图表分析作文2 The table / figure / graph / chart shows that 图表总述from 年代to年代. It is self-evident that 突出的数据变化. Three possible reasons contribute to 具体表示急剧上升、下降或特殊现象的词或代词代替上文内容. One reason is that原因一. Another reason is that原因二. For instance,举例证. What’s more原因三. As a result, 重述上文之趋势. However, in my opinion 作者观点. For one thing,理由一. For another, 理由二. To sum up,总结上文. 图表分析作文3 It can be seen from the table / figure / graph / chart that图表总述between年代and年代. Especially,突出的数据变化. Why are there such great changes during 图表涉及的年头数years? There are mainly two reasons explaining具体表示急剧上升、下降或特殊现象的词或代词代替上文内容. First,原因一. In the old days,比较法说明过去的情况. But now,说明现在的情况. Second,原因二. As a result,总结上文. In my viewpoint,作者自己的观点. On the one hand,论点一. On the other hand,论点二. 图表分析作文4 As the table / figure / graph / chart shows,图表总述in the past years年代. Obviously,突出的数据变化. Why are there such sharp contrasts during 图表涉及的年头years? Two main factors contribute to具体表示急剧上升、下降或特殊现象的词或代词代替上文内容. First of all,原因一. In the past,比较法说明过去的情况. But now 说明现在的情况. Moreover,原因二. Therefore,总结上文. As I see it,作者自己的观点. For one thing,论点一. For another,论点二. 图表作文补充句型 ?As is shown in the graph… 如图所示… ?The graph shows that… 图表显示… ?As can be seen from the table,… 从表格中可以看出… ?From the chart, we know that… 从这张表中,我们可知… ?All these data clearly prove the fact that… 所有这些数据明显证明这一事实,即… ?The increase of …. In the city has reached to 20%. ….在这个城市的增长已达到20%. ?In 1985, the number remained the same. 1985年,这个数字保持不变. ?There was a gradual decline in 1989. 1989年,出现了逐渐下降的情况.
英语四级图表作文讲解及参考范文 图表作文也是四(六)级考试中常见,而且被认为是一种较难的作文形式。图表作文就是把非文字信息(通常为各种图表表示的数字信息等)转换成文字信息的一种作文。它要求我们用文字来描述非文字性的图表或对图表显示的关系作解释说明。 第一节图表作文的出题形式和写作要领 一、图表作文常见出题形式 图表作文一般在题目中给出作文的标题和一个或几个统计表格、圆形图、曲线图或条形图,有时还用英文或中文提纲的形式给出提示,要求我们: 1)用文字描述图表,客观解释图表中所传递的信息,并找出某种规律或趋势; 2)就图表中所反映的某种趋势或问题分析其原因或后果。 图表作文着重说明事实,常常是通过对图表中所反映的具体数据的说明、分析、比较,对某种事物或现象的事实或变化情况等加以说明,并提出结论或看法。因此,图表作文常常采用议论文体的写作方法。 写好图表作文,关键在于能否读懂图表中所提供的信息,把握各信息间的联系,用准确流畅的语言把这一信息表达出来,并就这一信息发表自己的看法。 二、图表作文的写作步骤 写图表作文时,要注意遵循以下步骤: 1)认真分析图表的含义,弄清图表中所含的信息及不同信息间的关系; 2)确定文章的主题思想,构思出文章的基本框架,筛选出能说明图表主题思想的典型数据; 3)编列文章的提纲; 4)根据文章的提纲,将各段的提纲内容扩展成段落,然后将各个段落组成文章,注意段与段之间的衔接与过渡; 5)检查与修改。
三、图表作文的篇章结构 写图表作文时,常采用三段式的陈述方式。文章的第一段往往分析图表中的数据变化反映什么问题或趋势,概述图表所揭示的信息。第二段分析造成这一问题或趋势的原因。第三段则展望未来的情况或提出解决问题的办法或建议。这一结构可以简单地表述为: 第一段:概述图表反映的主题思想(总趋势+极端值+特点,时态) 第二段:分析产生的原因 第三段:展望未来或提出方法或建议 模板一 ①总的趋势②图表具体描述③剖析图表所揭示的含义 ④理由一⑤理由二⑥理由三⑦理由四⑧总结⑨前景预测 As can be seen from the table, the past decade has witnessed dramatic changes in①______. While ②_______. It is obvious from the table that③_________. What contributed to these changes? I think the reasons are as follows. To start with, ④______. Secondly, ⑤______ . What’s more, ⑥ _______. Last but not lease, ⑦________. In conclusion, ⑧_________. Moreover, ⑨ ________. 模板二 ①描述图表②分三方面解释原因③下结论 1) During the period from _______to _______, ________rose from ________to _______, while _______ decreased from _______ to _______. 2) We believe that three reasons can account for this phenomenon. First,____. Second, ____. Third, _____. 3) ___.We are happy to see that things are becoming better and better nowadays. We can imagine that ___. 模板三 ①描述图表②解释图表③补充解释 1) During the period between _______ and ________, ________ declined abruptly from _______ to ________, while ________ increased sharply from ________ to _______. 2) Several reasons can account for this phenomenon. Compared with _________ is much cheaper and more convenient__________ . Apart from that, _________. 3) However, there are still a number of people who _________, generally for two reasons. On the
图表及漫画类作文 一写作模板 (1) 组图写作模板 The story took place 时间和地点. 事件起因(要点一,图片一的内容). 事件的发展(要点二、三……,图片二、三……的内容). 事件结局(最后一个要点,最后一张图片的内容) From the story, I feel自己的看法或感想. (2)对比图写作模板 Great changes have taken place in地点since时间. In the past, 描述过去的情景(图片一的内容). But now our village/school/city is taking on a new look. 描述现在的情景(图片二的内容). There are many reasons for the great changes. First, 变化的第一个理由. Second, 变化的第二个理由. Third, 变化的第三个理由…Last but not least, 变化的最后一个理由. I think自己的感想. (3)单张图写作模板 As can be seen in the picture, 图画内容. The picture tells us概括图片大意. The implied meaning of this picture should be taken into consideration seriously. To begin with, 揭示涵义/原因/结果1. Second, 揭示涵义/原因/结果2. In my opinion/ As for me, we should take some measures to deal with the problem. First , we should具体措施1. Second, we must具体措施2. Only in this way can we solve the problem of 图画内容. (4)图表作文模板 As is shown/ indicated/ illustrated by the figure/ percentage in the table/ graph/ chart/ pie, _____________ (作文题目的议题)has been on rise/ decline, significantly/ dramatically/steadily rising/ decreasing from ________ to _______. From the sharp/ marked decline/rise in the chart, it goes without saying that ____________________. There are at least two reasons accounting for _______________. On the one hand, ______________. On the other hand, ___________ is due to the fact that ______________. In
图表类英语作文范文 图表类型的英语写作如果不擅于观察漫画的话,作文写出来可能会偏题。下面是小编给大家带来图表类英语作文,供大家参阅! 图表类英语作文范文篇1第一段:说明图表 开篇句:As the bar chart shows, ____ during the years of ____to____. 扩展句:1、As early as _____. 2、Then _____ years later, ____. 3、And arriving in the year ____, ____. 第二段:解释图表变化原因 主题句:Several factors contribute to _____. 扩展句:1、______. (原因1) 2、And ______.(原因2) 3、Furthermore, ______ (原因3) 4、All these result in ____. 第三段:提出解决办法 结尾句:However, ____ is faced with some problems. 扩展句:1、With _____, ____, the effect of which is not only discouraging, but also challenging. 2、So my principle is to pay due attention to ___, but not
justto____. 示范 第一段:说明图表 开篇句:As the bar chart shows, the number of people below the poverty line decreased dramatically during the years of 1978 to1997. 扩展句:1、As early as 1978, about 250 million people were under the poverty line. 2、Then seven years later, the number became three fifths thatof1978. 3、And arriving in the year 1997, the number was reduced to50millions. 第二段:解释图表变化原因 主题句:Several factors contribute to the sharp decrease of the below-poverty population. 扩展句:1、The reform and opening following 1978 enabled the peasants to become much better off. (原因1) 2、And with the development of Chinese economy, that policy also improved city dwellers lives greatly. (原因2) 3、Furthermore, the high-tech introduced made it possible for the countrys economy as a whole to take off. (原因3) 4、All these result in the great fall of the
图表类英语四级作文常用句型 开篇句式 1)According to the figures given in the table,+ 主题句(the world population is increasing rapidly. 2)The table(pie chart, line graph, bar graph) shows( indicates, illustrates, makes it clear) that +主题句(One’s income is closely linked to one’s age and education) 3) It can be seen from (It is clear from, It is evident from, It is illustrated from the table that + 主题句(the better one is educated , the higher his income is) 4) As the bar chart shows, the number of people below poverty line decreased dramatically during the years of 1978 to 1998. 图表式作文模板 写作模板——图表式作文 It is obvious in the graphic/table that the rate/number/amount of Y has undergone dramatic changes. It has gone up/grown/fallen/dropped considerably in recent years (as X varies). At the point of X1, Y reaches its peak value of …(多少). What is the reason for this change? Mainly there are … (多少)reasons behind the situation reflected in the graphic/table. First of all, …(第一个原因). More importantly, …(第二个原因). Most important of all, …(第三个原因). From the above discussions, we have enough reason to predict what will happen in the near future. The trend described in the graphic/table will continue for quite a long time (if necessary measures are not taken括号里的使用于那些不太好的变化趋势). 1.the table sho ws the changes in the number of……over the period from……to…… 该表格描述了在……年之……年间……数量的变化。 2.the bar chart illustrates that…… 该柱状图展示了…… 3.the graph provides some interesting data regarding…… 该图为我们提供了有关……有趣数据。 4.the diagram shows (that)…… 该图向我们展示了…… 5.the pie graph depicts (that)…… 该圆形图揭示了…… 6.this is a cure graph which describes the trend of……
2020年英语四级作文题目模板:图表图画型范文(四)四级作文题目:Student Use of Computer Students tend to use computers more and more frequently nowadays. Reading this chart, we can find that the average number of hours a student spends on the computer per week has increased sharply. In 1990, it was less than 2 hours; and in 1995, it increased to almost 4 hours, and in 2000, the number soared to 20 hours. Obviously computers are becoming increasingly popular. There are several reasons for this change. First, computers facilitate us in more aspects of life. Also, the fast development of the Internet enlarges our demands for using computers. We can easily contact with friends in remote places through the Internet. Besides, the prices of computers are getting lower and lower, which enables more students to purchase them. However, there still exist some problems, such as poor quality, out-of-date designs and so on. And how to balance the time between using computers and studying is also a serious problem. Anyhow, we will benefit a lot from computers as long as we use them properly.
图表作文(一) 第一节图表作文的类型 图表作文可分为两大类:表作文和图作文。 表作文 表格(Table)可以使大量数据系统化,便于阅读、比较。表格常由标题(Title)、表头(Boxhead)(表格的第一行)、侧目(Stub)(表格左边的第一列)和主体(Body)部分(表格的其余部分)等部分组成。如下表: 用表格表达的信息具体准确,而且表格中的各项均按一定规律排列。阅读表格时要注意找出表格中各个项目的相互关系,表格中各个项目的变化规律。例如,上面的表格中的数字说明,和1978年相比,1983年大学入学的人数在增加,而小学的入学人数在减少。搞清楚这些变化规律也就读懂了表格的内容。 图作文 图作文又可分为三种:圆形图作文、曲线图作文和条状图作文。 (1) 圆形图作文 圆形图(Pie chart)也称为饼状图或圆面分割图。圆形图因为比较形象和直观,各部分空间大小差别容易分辨,所以常用来表示总量和各分量之间的百分比关系。整个圆表示总量,楔形块表示分量。有时圆形图还有数值表,两者结合可把各分量表示得更准确、清楚。例如:This is a pie chart of the average weekly expenditure of a family in Great Britain. As can be see from the chart, the main expenditure of an average British family is spent on food, which accounts for 25% of its total expenditure. The next two significant expending items are transport and housing, which are 15% and 12% respectively. If we take into account clothing and footwear, which makes up 10%, the four essentials of life, that is, food, transport, housing, and clothing and footwear, amount to 62% of the total expenditure. (2) 曲线图作文 曲线图(Line graph)也称为线性图或坐标图。曲线图最适合表示两个变量之间关系的发展过程和趋势。一般来说,曲线所呈现的形状比某一点所代表的变量的值更有意义。曲线图有横轴和纵轴。一般先看横轴所代表的数量或时间等,然后再看纵轴所显示的意义。同时必须找出线条所反映的最高或最低的变化。例如: 这个曲线图的横轴代表1990年的不同的月份,纵轴代表交通事故的数量。从交通事故曲线图上可知,前八个月的交通事故的数量有升有降。曲线图在八月份升到了最高点(39),此后一直呈下降的趋势,十二月份降到了最低点(16)。可见,1990年的交通事故的数量总体上呈下降的趋势。 (3) 条形图作文 条形图(Bar graph)也称为立柱图或圆柱图。条形图由宽度相同但长度不同的条块代表不同的量。当要比较几个项目或量时,常用不同颜色来区分。条形图主要用来表示:1)同一项目在不同时间的量;2)同一时间不同项目的量。阅读条形图时,要先看图例,再看横轴、纵横各代表什么量,每一个刻度所代表的值是多少,最后找出图中各长条所表示的数据及各长条间的相互关系。例如: 左边的条形图的横轴代表时间,纵轴代表期望寿命(Life Expectancy),这一条形图想要体现的是同一项目(期望寿命)在不同时间的量。右边的条形图的横轴也是代表时间,纵轴是代表婴儿的死亡率(Infant Mortality),这一条形图想要体现的也是同一项目(婴儿的死亡率)在不同时间的量。左边的条形图表明1990年的人均期望寿命比1960年的人均期望寿命长20岁,而1990年的婴儿死亡率比1960年的婴儿死亡率下降了50%。
大学英语作文 英语四级写作图表类作文模板 It seems to me that the cartoon / drawing is sending a message about ____________(图画内容),which reveals ____________(稍作评价).In my perspective of view, ____________ (表明个人观点)。Apparently, ____________(将个人观点和图片内容相结合,得出观点。)For one thing, ____________(从社会角度论证). For another thing, ____________(从个人角度说明). For example, ____________(自己、朋友或他人,只要自己知道或听过的例子).Last but not least, ____________(从反面角度谈论). As a result, the drawer of the illustration is urging us to_____________(建议或措施).Only in this way can we ____________(展望结果). In conclusion / To my understanding, ____________(再次表明观点或态度). We should____________(进一步说明个人的观点). 图表模板:According to the bar chart / pie chart / line graph displays the changes in the number of____________(图表整体趋势). There was an increase in ____________(图表细节). At the point of ____________, ____________reaches its peak value of
考研英语图表类作文模板 图标类的作文应该怎么写比较合适呢?以下是小编整理的考研英语图表类作文,欢迎参考阅读! 考研英语图表类作文模板1 From the table chart given above, we can observe that it reflects the statistics of students’graduation intentions. From 2004 to 2012, the proportion of students who were determined to further study increased rapidly from 45% to 76%. During the same period, the percentage of students who were willing to work after graduation remains steady, around 55% to 60%. The table chart informs us of the phenomenon that students in increasing numbers are willing to further study after graduation. What exactly contributes to this phenomenon? Reasons can be listed as follows: for one thing, faced with intense competition in the society, quite a few students are convinced that a higher education will put them in a competitive position in the future employment market. For another, their decision could also be attributed to the power of so-called “group dynamics”: when their friends and classmates choose to study after graduation, they will be influenced easily and imitate other’s behavior. By observing the tendency of the past, we may forecast that the proportion of further study will continue to rise. However, students should bear in mind that a higher education will not guarantee them an ideal job. It is capabilities and skills that determine their future. 考研英语图表类作文模板2 The pie charts inform us of the phenomenon that there exists some difference in the sources of income between American and Chinese students. When it comes to American