图表图画类作文课后作业及范文
一、For this part, you are allowed thirty minutes to write a composition on the topic People below Poverty Line.
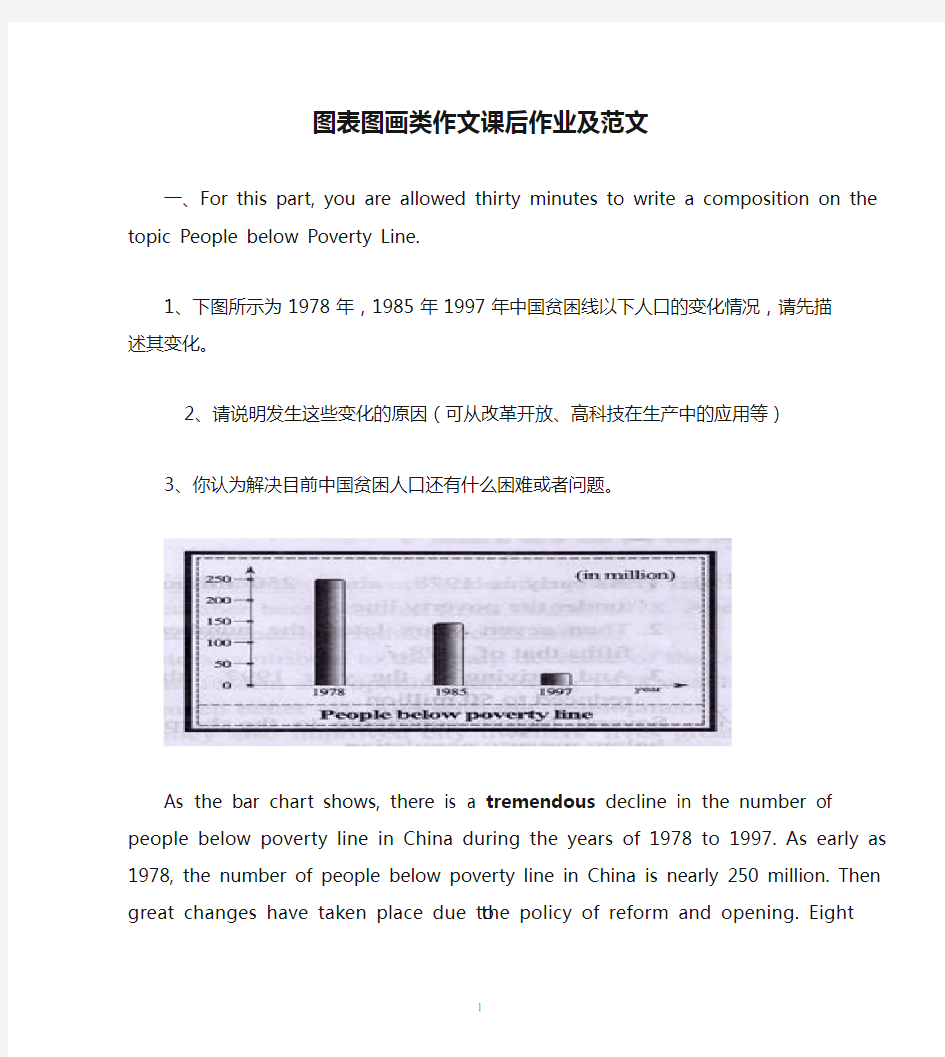
1、下图所示为1978年,1985年1997年中国贫困线以下人口的变化情况,请先描述其变化。
2、请说明发生这些变化的原因(可从改革开放、高科技在生产中的应用等)
3、你认为解决目前中国贫困人口还有什么困难或者问题。
As the bar chart shows, there is a tremendous decline in the number of people below poverty line in China during the years of 1978 to 1997. As early as 1978, the number of people below poverty line in China is nearly 250 million. Then great changes have taken place due to the policy of reform and opening. Eight years later, the number had been strikingly reduced to less than 150 million. From then now, the society has also undergone a major transformation. Arriving in the year 1997, the number incredibly dropped to about 25 million.
There are several factors contributing to the sharp decrease of the below-poverty population. First and foremost, the reform and opening following 1978 enabled the peasants to become much better off. In addition, with the development of Chinese economy, that policy also improved city dwellers' living standards prodigiously. Furthermore, the high-tech introduced made it possible for the country's economy as a whole to take off. All these result in the stupendous fall of the Chinese population below the poverty line.
However, a further reduction in the number of poverty-stricken people is faced with some serious problems. Nowadays, quite few employees have been laid off. What’s more, university graduates also realize that it difficult to find a job to earn a living. Not only is the effect of unemployment discouraging, but it is also challenging. As a result, it is high time that government officers made some regulations to solve the problem.
二. Study the following tale carefully and write an essay of at least 150 words
You essay should meet the requirements below
1.Changes in people’s daily expenses in the past five years
2.Give possible reasons for the changes
3.Draw my own conclusions
.
In the past five years, there have been great changes in people’s daily expenses I XX city. According to the figures given in the table, the amount of money spent on food decreased gradually, accounting for 35 percent in 1998. However, there was a rapid increase in clothing expenses, which made up 17% in 1998. In addition the table shows an upward tendency in recreation expenses. The same was the case with other expenses.
What case these remarkable changes? In my opinion, it can be attributed to the following reasons:(也可以It is to the credit of the following reasons:)。To begin with, with the rapid development of agriculture in China, the output of grain, fruit, vegetables, and milk has sharply increased, which contributes to the decline in their prices. Then, the family incomes of people both in the city and in the country have greatly risen so that people now can afford expensive clothing and some of them even want to dress in the latest fashion. Finally, as the living conditions improve, the demand for a variety o recreations is growing steadily, too.
In short, with the incomes rising continuously, people are no longer reconciled to living a simple, monotonous life. They are eager to make their life interesting and exciting. Therefore, I am sure that people will spend more money on clothing and recreations.
1.请根据下表用英语写一篇短文,介绍某地区5年来人们的饮食变化情况。
内容要点:
1)饮食变化的情况。
2)说明人们饮食方面发生变化的原因。
3)变化说明了什么及所带来的好处。
food 2000 2001 2002 2003 2004
grain 44% 44% 43% 42% 42%
meat 19% 21% 23% 23% 22%
Fruit and vegetable 25% 23% 21% 21% 21%
milk 12% 12% 13% 14% 14%
total 100% 100% 100% 100% 100%
It is obvious in the table that the diet habit of the people in some area underwent dramatic changes from 2000 – 2004. The amount of grain they ate fell year by year, and at the same time they increased their consumption of milk and meat. Besides, the consumption of fruit and vegetables fell from 25% to 21%.
There are two reasons for the changes. For one thing, with the increasing living standard, people are better off and can afford more expensive food of better nutrition. For another, more and more people begin to pay attention to the quality of their diet, because hey believe a balanced diet does good to their health. These changes in people’s diet shows that their living conditions improved greatly between 2000 and 2004. We are sure that they are living a happier and healthier life.
From the above discussions, we have enough reason to predict what will happen in the near future. The trend described in the table will continue for quite a long time, I think.
2.DIRECTIONS:
A. Study the following graphs carefully and write an essay in at least 150 words.
B. Your essay should cover these three points:
1) effect of the country’s growing human population on its wildlife
2) possible reason for the effect
3) your suggestion for wildlife protection
【段落类型分析】
第一段第二
段第三段
图画/图表描述段原因阐释段建议措施段
【参考范文一】
From these graphs, we can draw a conclusion that, with the growth of human population, the number of species has decreased rapidly in America, and some species have even vanished from our planet.
There are numerous reasons accounting for the phenomenon and I would like to explore a few of the most important ones here. Above all, as the human population grows rapidly, a growing number of people came to live where some wild species have been living. Then these species have to move to other places. Some of them probably can not adapt to the new environment and die. In addition, although many people look on the wildlife as their friends, some people may not think so. They catch a lot of wild animals and sell them in order to get more money. Consequently, the natural balance and the ecologic environment are destroyed. The clear cutting has become increasingly serious. So some of the wildlife become homeless and extinct.
In order to protect the wildlife, I have some suggestions. First, the governments should make laws to prevent them from being caught and killed. Second, the governments should educate people to love nature and protect it. Third, as for ourselves, we should take practical actions to protect our living environment. (210 words)
【参考范文二】
The two charts show that the increase in the U.S. population has been accompanied by a corresponding decline in the number of wildlife species. Far too many species have been lost already. This poses a danger to the ecological balance.
As the human population expands, wild animals in mounting numbers are hunted for food, or because they are thought to present a threat to man. But studies show that one of the primary causes of the disappearance of wildlife is pollution, which is one of the consequences of population growth and economic development. This makes us wonder if men are able to share this planet in harmony with other life forms.
In my opinion, it is imperative for us to take steps to reverse the disturbing trend illustrated in the charts. One measure would be to forbid the building of cities in areas where wild life is threatened with extinction. But, more importantly, men must learn to stop polluting the environment, or he himself
will be extinct. (167 words)
【参考范文三】
As is seen from the two graphs, it is clear that with the rapid growth of U.S. population from 1800 to 1990, the number of its wildlife species no longer existing soared during the same period. Naturally, we can draw the conclusion that the sharp decline of wildlife species resulted from the population growth.
Several reasons may account for this phenomenon. To begin with, as the population grows, people consume much more natural resources. Second, with the increase of human activities, modern people take up more and more space which exerts a great influence on other species. Finally, the problem of pollution becomes more and more serious with the development of modern industry. More and more animals have to adapt themselves to the decaying environment or move to a totally different place, but not all of them are fortunate enough to survive the changes.
Solving this problem calls for, above all, the government’s efforts to control population growth, to decrease industrial pollution and to enhance the laws to forbid wildlife hunting. Moreover, common citizens should be aware of this ecological crisis and take on the responsibility of wildlife protection. In a word, only when the government and the common people make joint efforts can we hope to find a satisfactory solution to this problem. (216 words)
考研英语作文范文(图表提纲式作文) 2
Directions: Study the following graphs carefully and write an essay of about 200 words within 40 minutes. Your essay must meet the requirements below.
1. Write out the message conveyed by the graph.
2. Make an analysis of the strange phenomenon
3. Give your comments
正如上面两张曲线图所示,从1990年到1995年蛋类的平均价格不断上升,并且其需求量也相应增加。曲线图还表明,从1995年到2000年期间蛋类价格下降,而且需量也下降。这
种现象是很奇怪的并值得研究。根据市场经济法则,需求量增加会引起价格上涨。也就是说,当价格上升时,需求就下降,而当价格回落时,需求就增加。但是现在的现实恰好相反。
产生这种奇怪的现象的原意是很明显的。从1990年到1995年期间随着我国社会主义市场经济的发展,人民的收入,其中包括工资、奖金和各种补贴迅速增加。虽然蛋类价格的需求量也急趋增加。另一方面,当蛋类的需求达到某一点时,需求量就停止上升,因为人们开始把越来越多的钱花在衣着、娱乐和国内外的旅游上。普遍认为,从1995年到2000年旅游开支占我国人民总消费量的很大一部分。因此,同期蛋类需求量的下降也似乎是合理的。
我的看法是,由于家禽养殖业的不断发展,蛋类价格很可能下降,因为对蛋类的需求有限,消费量的下降也是必然的。
As is shown by the two graphs above, the average price of eggs was on the rise from 1990 to 1995 and the demand for them increased correspondingly. The graphs also indicate that during the period from 1995 to 2000 the price eggs declined, and so did the demand. The phenomenon is quite strange and worth studying. According to the law of market economy, the increase in demand results in higher prices. That is to say, when prices climb, the demand decreases, and when prices fall, the demand grows. Now the reality was just the other way round.
The reasons for this strange phenomenon are obvious. During the period from 1990 to 1995 with the development of our socialist market economy people’s income, bonus and different kinds of benefits, increased rapidly. Though the price of eggs rose gradually, the demand for them grew sharply, too. On the other hand, when the demand for eggs reached a certain point, it stopped rising because people began to spend more and more money on clothing, recreations and tours round the country and even round the world. It is generally assumed that the expenses for tours accounted for a great part of the total consumption of the people in our country from 1995 to 2000. As a result, it seemed reasonable that the demand for eggs declined during the same period of time.
As far as I’m concerned, with the domestic poultry farming continuing to develop, the price of eggs is likely to decline because the demand for them is limited and the fall in consumption of them is also inevitable. (270 words)
在这则对话中,Rocky Simons 是一家制造休闲快艇小公司的业主。他正和另外一个国家一家海滨度假地的业主Jacques Riviera在电话里交谈。
Rocky: Good morning, Jacques. Nice talking to you again. How's the weather in your part of the world? 早上好,Jacques,很高兴又和你通话。你们那儿的天气怎么样?
Jacques: Couldn't be better, Rocky. Sunny, 29°, light breeze...
再好不过了,Rocky。晴朗,29度,微风……
Rocky: Stop! I can't take any more. So, what can I do for you, Jacques?
别说了!我受不了了。我能为你做什么吗?
Jacques: I need a couple of your SB2000 speedboats to rent to guests. Can you give me a price quote? 我需要两只你们生产的SB2000快艇,好租给游客。你能给我个报价吗?
Rocky: Let's see. Uh, the list price is $6,500 U.S. You're a valued customer, so I'll give you a 10% discount.
让我想想……呃,报价单上是6,500美元。您是我们的一个重要客户,我会给你10%的折扣。
Jacques: That's very reasonable. Do you have them in stock?
那很合理。你们有现货吗?
Rocky: Sure do! We set up new inventory controls last year, so we don't have many backlogs any more. 当然有!我们去年建立了新的存货控制系统,所以我们不再有很多的积压订单。
Jacques: That's good. The tourist season is just around the corner, so I need them pretty quick. What's the earliest shipping date you can manage?
那很好。旅游旺季就要到了,所以我很快就需要它们。最早的发货日期是什么时候?
Rocky: They can be ready for shipment in 2-3 weeks.
可以在2-3周内准备好装船。
Jacques: Perfect. What's the total CIF price, Rocky?
棒极了。到岸价格是多少,Rocky?
Rocky: Hang on. The price will be $15,230 U.S. to your usual port. Do we have a deal?
稍等。价格是15,230美元,到原先的港口。成交吗?
Jacques: You bet! Send me a fax with all the information, and I'll send you my order right away. I'll pay by irrevocable letter of credit, as usual. Same terms as always?
当然!给我发一份所有相关信息的传真,我会立即下订单。我会按惯例以不可撤销信用证方式付款。按照一惯的条款吗?
Rocky: Of course.
当然。
Jacques: Great! Nice doing business with you again, Rocky. Bye for now, and say hello to the family for me.
好极了!很高兴再次和你做生意,Rocky。那再见了,代我问你家人好。
Rocky: Will do, and the same goes for me. Bye, Jacques.
我会的,也代我问侯你家人。再见,Jacques.
第一段3句 1总体描述:1句 1.As is vividly/symbolically depicted in the picture/cartoon ,we can notice that____ As is vividly(subtly/symbolically)depicted (shown/described/revealed/portrayed /demonstrted/illustrated)in the photo(caricature/carton/drawing/picture/ photograph)above______________________________________ Having captured our attention,the picture vividly betrays the fact (表现出事实)that___ This set of drawing vividly reflects the fact that____(一组图) 2细节描述1-2句 3文字说明/象征寓意: (1)文字说明: 会写的话:The picture is captioned “________ ”,which indicates that_______ 文字不会写的话:The caption reads that___________ (2)象征寓意:It is apparent that 第二段5句左右 论证部分: At first thought ,people may consider _____.But deeper thinking leads us to its core meaning___ 1主题句1句:(中心) (1)The purpose of the picture is to tell us that_____保护环境保护传统文化_____is of great significance to us human. (2)This picture dose reflect a thought-provoking social phenomenon which is not uncommon in China now that___社会现象____ (3)However,the man in the picture ,who_____,is not an isolated example._社会风气_is a problem pervasive throughout our society。 (4)A life philosophy is clearly reflected above that__人生哲理____. (5)The purpose of the picture is to tell us that it is impretive to_____ (6)Among the topic concerning __象征寓意____,as the depiction shows,the most cardinal top is related to the issue of ___象征寓意具体化____。 (在_____画题中,正如漫画所给,最核心的点是_______。) (7)Undoubtedly , through the thought-provoking illustration,the drawer aims at reminding us the significance of_____(强调重要性) (8)Through the incentive illustration ,the drawer aims to point out the advantanges and disadantages of______(有好有坏的)、 (9)The recent a few years has witnessed a phenomenon of 主题(不好的现象)which seems to be disastrous to individual survival and prosperity. 对我们的生存和社会的繁荣造成影响 论证部分:
图表类英语作文范文英语作文模板(图表类的)这里很全 一、图表类作文常用的单词、短语和句型 1.表示数据变化的单词或短语 in the case of (在……的情况下) in terms of (在……方面) increase / raise / rise / go up(增加) decrease / grow down / drop / fall (减少) increased by (增长了) increased to (增长到) the number sharply goes up to(数字急剧上升至)
significant(重大的),steady(平稳的),gradual(逐渐的),slow(慢慢的),stable(稳定的),rapid(快速的)…… 2. 表示从图表得知的信息的句型 The table / chart / graph shows that...(这个图表告诉我们……) Aording to the table / chart /graph, we can see that...(根据图表,我们可以看出……) It can be concluded from the graph that...(从图表中可以得出……) The table shows the changes in the number of...over the period from...to...(该表格描述了在……期间……数量的变化) 二、图表类作文的模式
图表类作文中的图表主要有以下形式:柱形图类(chart)、圆饼图类(pie chart)、曲线图类(line chart)、表格类(table)。写文章时,首先要对图表加以描述,而后引出主题加以讨论,最后得出结论,也就是按照描述图表—解释原因—下结论的步骤来写。切忌对图表不作交代就直接谈论主题。 1.表格类作文的模式 表格类作文一般可以分为三段:第一段对表格中的数据进行描述,只要抓住变化规律即可,切忌一一列举数据;第二段说明变化的原因;第三段得出结论。即: (1) Studying the table carefully, we can see...(仔细研读表格,我们可以看出……) (2) In my opinion, the reasons why...are as follows. Firstly...Secondly...Thirdly...(在我看来,为什么……的原因在于以下几点:第一……第二……第三……)
图表作文写作指导 图表作文至少包含描述图表与解释原因两个部分,而当前的图表作文大多还有第三个段落。图表作文的规律性很强,不像图画式作文那样富于变化。 1.首段的写作 图表作文有表格(table)、柱形图(bar chart)、饼状图(pie chart)和折线图(diagram)之分,后三种都属于图表的范畴(chart)。不管是chart还是table,都需要进行描述,一般放在文章的第一部分,长度宜适中。描述数据我们要首先看看是几个变量(A),每个变量有几个数据(B),不妨以A*B表示。 如果只有一个变量,有三个数据,可以描述如下: From the chart we can see clearly that the average number of hours a student spends on Internet per week has increased from less than two hours in 1998 to nearly four hours in 2000, and then to 20 hours in 2004. 如果是最常见的是2*3的情形,可以描述如下: From the chart, we can see clearly that in a big city in China, state-owned houses declined from 75% in 1990 to 60% in 1995 and then to 20% in 2000, while private houses rose from 25% to 40% and then to 80% during the same period. 这里用了while引起从句来突显对比,是一种非常好的办法,如果用两句话来描述,也完全可以。 如果是1*n(n>3)的情形,将头与尾描述出来即可,比较好的方法就是在句中描述最后一个与第一个相比变化了多少。 碰到多变量、每个变量多数据的情形,大家应首先进行分类,分成上升、下降两类,或者上升、下降、不变三类,这样问题就迎刃而解了。 2.第二段的写作 第二段是解释原因的段落。我们谈谈两个问题。 首先是过渡句这个问题。这里不大可能放在第一段,因为第一段不可能像某些命题作文那样简洁(如只有一句)——例如提纲式作文中的批驳类文章中除第二段首句批驳之外还有首段末句批驳,效果很强烈。 其次就是此段的主题句(topic sentence)的问题。此句或主观或客观,并无拘束,只要上下文风格统一即可。 主观:We believe that three reasons can account for this phenomenon. I believe that three reasons can account for this phenomenon. In my mind, the reasons why the overseas students are on the rise are as follows. 主观之变体(使用插入语,突显主语):Three reasons, we believe, can account for this phenomenon. Three reasons, I believe, can account for this phenomenon. Three reasons, I firmly believe, can account for this phenomenon. 注意:插入语的使用属于看似平淡却极富功力的技巧,可以达到很好的效果。
2020高考英语作文写作模板篇一 图画作文模板 As is vividly shown in the picture, .(描述图画内容)The picture/cartoon informs us of the phenomenon that .(图画反映的现象) These may/might be several factors contributing to/responsible for the phenomenon/problem. To start with, . Sec ondly, . What’s more, . Last but not least, .(说明原因) In my opinion, the government/the school/we should take measures to/something must be done to . Only in this way can the problem be really Only when everyone can do so will our world become more and more beautiful.(解决问题的方法) 延伸阅读:其他优秀模板两篇 2020高考英语作文写作模板篇二 利弊对比型议论文模板 Nowadays, there is a widespread concern over .(引出话题或对象) In fact, there are both advantages and disadvantages in . Generally speaking, it is widely believed that there are several positive aspects as follows. Firstly, .(优点一)And secondly, .(优点二) Just as a popular saying goes, "Every coin has two sides." is no exception, and in other words, it still has negative aspects. To begin with, .(缺点一)In addition, .(缺点二) To sum up, we should try to bring the advantages of into full play, and reduce the disadvantages to the minimum at the same time. In that case, we will definitely make a better use of .(总结) 2020高考英语作文写作模板篇三 正反观点对比型议论文模板 There is a widespread concern over the issue that . But it is well known that the opinion concerning this hot topic varies from person to person.(引出话题)
图表分析作文1 As is clearly shown in the table/ figure/ graph / chart, 图表总体描述between 年代and 年代. Especially, 突出的数据变化. There are three reasons for 具体表示急剧上升、下降或特殊现象的词. To begin with, 原因一. In addition / Moreover, 原因二. For example, 具体例证. Last but no least, 原因三. In short,总结上文. As far as I am concerned, / For my part, / As for me,作者自己的观点. On the one hand, 理由一. On the other hand, 理由二. In brief,总结上文. 图表分析作文2 The table / figure / graph / chart shows that 图表总述from 年代to年代. It is self-evident that 突出的数据变化. Three possible reasons contribute to 具体表示急剧上升、下降或特殊现象的词或代词代替上文内容. One reason is that原因一. Another reason is that原因二. For instance,举例证. What’s more原因三. As a result, 重述上文之趋势. However, in my opinion 作者观点. For one thing,理由一. For another, 理由二. To sum up,总结上文. 图表分析作文3 It can be seen from the table / figure / graph / chart that图表总述between年代and年代. Especially,突出的数据变化. Why are there such great changes during 图表涉及的年头数years? There are mainly two reasons explaining具体表示急剧上升、下降或特殊现象的词或代词代替上文内容. First,原因一. In the old days,比较法说明过去的情况. But now,说明现在的情况. Second,原因二. As a result,总结上文. In my viewpoint,作者自己的观点. On the one hand,论点一. On the other hand,论点二. 图表分析作文4 As the table / figure / graph / chart shows,图表总述in the past years年代. Obviously,突出的数据变化. Why are there such sharp contrasts during 图表涉及的年头years? Two main factors contribute to具体表示急剧上升、下降或特殊现象的词或代词代替上文内容. First of all,原因一. In the past,比较法说明过去的情况. But now 说明现在的情况. Moreover,原因二. Therefore,总结上文. As I see it,作者自己的观点. For one thing,论点一. For another,论点二. 图表作文补充句型 ?As is shown in the graph… 如图所示… ?The graph shows that… 图表显示… ?As can be seen from the table,… 从表格中可以看出… ?From the chart, we know that… 从这张表中,我们可知… ?All these data clearly prove the fact that… 所有这些数据明显证明这一事实,即… ?The increase of …. In the city has reached to 20%. ….在这个城市的增长已达到20%. ?In 1985, the number remained the same. 1985年,这个数字保持不变. ?There was a gradual decline in 1989. 1989年,出现了逐渐下降的情况.
一、图表作文写作常识 1、图形种类及概述法: 泛指一份数据图表:a data graph/ch art/diagram/illustration/table 饼图:pie chart 直方图或柱形图:bar chart / histo gram 趋势曲线图:line chart / curve di agram 表格图:table 流程图或过程图:flow chart / sequ ence diagram 程序图:processing/procedures dia gram 2、常用的描述用法
The table/chart diagram/graph sho ws (that) According to the table/chart diag ram/graph As (is) shown in the table/char t diagram/graph As can be seen from the table/cha rt/diagram/graph/figures, figures/statistics shows (tha t)…… It can be seen from the figures/s tatistics We can see from the figures/stati stics It is clear from the figures/stat istics It is apparent from the figures/s tatistics
table/chart/diagram/graph figures (that)…… table/chart/diagram/graph shows/d esc ribes/illustrates how…… 3、图表中的数据(Data)具体表达法 数据(Data)在某一个时间段固定不变:fixed in time 在一系列的时间段中转变:changes o ver time 持续变化的data在不同情况下: 增加:increase / raise / rise / g o up …… 减少:decrease / grow down / drop / fall …… 波动:fluctuate / rebound / undul ate / wa ve …… 稳定:remain stable / stabilize / level off ……
图表及漫画类作文 一写作模板 (1) 组图写作模板 The story took place 时间和地点. 事件起因(要点一,图片一的内容). 事件的发展(要点二、三……,图片二、三……的内容). 事件结局(最后一个要点,最后一张图片的内容) From the story, I feel自己的看法或感想. (2)对比图写作模板 Great changes have taken place in地点since时间. In the past, 描述过去的情景(图片一的内容). But now our village/school/city is taking on a new look. 描述现在的情景(图片二的内容). There are many reasons for the great changes. First, 变化的第一个理由. Second, 变化的第二个理由. Third, 变化的第三个理由…Last but not least, 变化的最后一个理由. I think自己的感想. (3)单张图写作模板 As can be seen in the picture, 图画内容. The picture tells us概括图片大意. The implied meaning of this picture should be taken into consideration seriously. To begin with, 揭示涵义/原因/结果1. Second, 揭示涵义/原因/结果2. In my opinion/ As for me, we should take some measures to deal with the problem. First , we should具体措施1. Second, we must具体措施2. Only in this way can we solve the problem of 图画内容. (4)图表作文模板 As is shown/ indicated/ illustrated by the figure/ percentage in the table/ graph/ chart/ pie, _____________ (作文题目的议题)has been on rise/ decline, significantly/ dramatically/steadily rising/ decreasing from ________ to _______. From the sharp/ marked decline/rise in the chart, it goes without saying that ____________________. There are at least two reasons accounting for _______________. On the one hand, ______________. On the other hand, ___________ is due to the fact that ______________. In
1. The charts below show the percentage of their food budget the average family spent on restaurant meals in different years. The graph shows the number of meals eaten in fast food restaurants and sit-down restaurants. You should write at least 150 words. Give reasons for your answer and include any relevant examples from your own knowledge or experience.
Over the past 30 years, the average family has dramatically increased the number of meals that they eat at restaurants. The percentage of the family's food budget spent on restaurant meals steadily climbed. Just 10 percent of the food budget was spent on restaurant meals in 1970, and 15 percent in 1980. That percentage more than doubled in 1990, to 35 percent, and rose again in 2000 to 50 percent. Where families eat their restaurant meals also changed during that 30-year period. In 1970, families ate the same number of meals at fast food and sit-down restaurants. In 1980, families ate slightly more frequently at sit-down restaurants. However, since 1990, fast food restaurants serve more meals to the families than do the sit-down restaurants. Most of the restaurant meals from 2000 were eaten at fast food restaurants. If this pattern continues, eventually the number of meals that families eat at fast food restaurants could double the number of meals they eat at sit-down restaurants. (164 words) 2. The table below shows the sales at a small restaurant in a downtown business district. Summarize the information by selecting and reporting the main features, and make comparisons where relevant. You should write at least 150 words. Give reasons for your answer and include any relevant examples from your own knowledge or experience.
How People Spent Their Holidays As can be seen from the table, the past decade have witnessed dramatic changes in the way people spent their holiday between 1990 and 2000.In 1990, 63% of people spent their holidays at home, while the figure dropped considerably to 24% in 2000. It is obvious from the table that people tended to be more and more mobile, and they wanted to get entertainment in the outside world. What contributed to these changes? I think the reasons are as follows. To start with, with the rapid development of economy, people earn by far more money than they used to. Thus, people are able to afford traveling expenses. Secondly, people think it important to get well-informed about the outside world in this new era when everything is on the move. Traveling, of course, is a sure way to achieve this goal. What's more, in this competitive society, people are usually under great stress. However, it is not difficult to find traveling an effective way to relieve people's stress and get relaxation. Last but not least, by traveling outside, people are close to nature, which is not only beneficial to both their health and peace of mind. In conclusion, people prefer to go traveling rather than stay at home during holidays for a combination of reasons. Moreover, it seems that this trend will last in the foreseeable future. 人口增长对野生动物的影响(99年真题) [2.图画/图表描述段] From these graphs, we can draw a conclusion that, with the gro wth of human population, the number of species has decreased rapidly in America, and so me species have even vanished from our planet. [6.原因列军段]Why does this phenomenon appear? There are several possible reasons for this. Above all, as the human population grows rapidly, a growing number of people came to live where some wild species have been living. Then these species have to mov
图表类英语作文范文 图表类型的英语写作如果不擅于观察漫画的话,作文写出来可能会偏题。下面是小编给大家带来图表类英语作文,供大家参阅! 图表类英语作文范文篇1第一段:说明图表 开篇句:As the bar chart shows, ____ during the years of ____to____. 扩展句:1、As early as _____. 2、Then _____ years later, ____. 3、And arriving in the year ____, ____. 第二段:解释图表变化原因 主题句:Several factors contribute to _____. 扩展句:1、______. (原因1) 2、And ______.(原因2) 3、Furthermore, ______ (原因3) 4、All these result in ____. 第三段:提出解决办法 结尾句:However, ____ is faced with some problems. 扩展句:1、With _____, ____, the effect of which is not only discouraging, but also challenging. 2、So my principle is to pay due attention to ___, but not
justto____. 示范 第一段:说明图表 开篇句:As the bar chart shows, the number of people below the poverty line decreased dramatically during the years of 1978 to1997. 扩展句:1、As early as 1978, about 250 million people were under the poverty line. 2、Then seven years later, the number became three fifths thatof1978. 3、And arriving in the year 1997, the number was reduced to50millions. 第二段:解释图表变化原因 主题句:Several factors contribute to the sharp decrease of the below-poverty population. 扩展句:1、The reform and opening following 1978 enabled the peasants to become much better off. (原因1) 2、And with the development of Chinese economy, that policy also improved city dwellers lives greatly. (原因2) 3、Furthermore, the high-tech introduced made it possible for the countrys economy as a whole to take off. (原因3) 4、All these result in the great fall of the
图画作文 1. 题型简介:看图作文是借助于图画或图表进行写作的一种文体。它要求作者将画面直观的内容或图片包含的信息转换成传神表意的文字形式,属于说明文性质。其目的是考察考生的观察分析能力、想象力和语言表达能力。作文的命题模式基本如下:给出标题、图画或图表、写作提纲、半小时内写出一篇120-180字左右的评论性文章。 看图作文要求:(1)主题明确,即能概括画面或图表所反映的中心议题;(2)图文一致,即要包括画面或图表中所反映的主要内容。 2. 写作方法: 2.1图画作文实质上就是描述、分析并评论一幅(或一组)图所反映的社会现象。对图画进行描述时,一般以被观察者为对象,联系图片中所包含的背景、插入的文字等,揣摩作者的绘画意图,以观众的口吻进行解说。如果看的是一组图画,就得按照图示的顺序,对画面上的内容进行整体分析,去除细枝末节,分清主次,抓住图画后隐藏的中心意思进行解说。切莫象记流水帐一样把所看到的、想到的细节全部写出来,这只会使读者感到乏味无趣。想象你自己就是这位画家,在画这副画之前,你首先要构思画的内容;其次是构思作画的步骤,先画什么,后画什么;然后将你的构思用文字叙述出来,你对该图画的描述就完成了。 2.2大体框架(具体按照写作要求进行调整): 1)第一段主要是描述图画中的信息和表达的含义。 2)第二段的全文的重点,一般都是要求具体分析图画中暗含的社会现象。 3)第三段的要求一般视具体的试题而定,有的要求给出自己的评论、有的要求举例、有的要求考生提出自己的建议以及针对现象应该采取的措施。 Tips:第二段和第三段的开头最好写一个主题句,既可以防止离题,又符合英文写作的习惯。 2.3 基本结构(具体按照写作要求进行调整) 第一段:引言/起始/淘金段,图画描述,3-4句 1. 总体描述:人物/动物/事物+动作+环境 1句 2. 挖掘细节词、串连成句:1-2句
图表作文 这类作文时,注意以下几点: 第一,审题时,除了要把握好图表的表层信息外,还要分析图标的深层含义,如原因、根源、可能的发展趋势等。图表中所提供的说明文字往往是问题的切入点,一定要仔细分析。 第二,描述数据时要抓住重点,为中心服务,不必面面俱到,切忌毫无目的地罗列图表中的数据。如果数据较多,抓住图表中的极端点(如最大或最小、最多或最少,最好或最差)和基本相同进行描述。 第三,主题句应明确,最好放在文章的开头,这样会使重点突出,主题明了。 常见模板 第一段:总体描述图表,指明时间段,指出突出变化或不同 常用句型或短语: As is clearly shown in the char/ table/graph, ___________ According to the figures given in the table/chart/graph, ____________ It can be seen from the table/chart/graph, _____________________. The figures in the table/chart reflect that ________________. especially, ________________(指出突出变化) 第二段:(分析原因) There are several factors leading to this change / difference …….. There are several reasons for _____________.(引出原因) To begin with, _______(原因一) In addition, ______________(原因二0 For example, _________(举例说明) Last but not the least, __________(原因三) To sum up——————————————(简要总结) 第三段:自己的观点 As for me, ____________ On the one hand, ________ on the other, ____ In brief,_____________________. 数据变化常用句型 表示逐句增长 The number of …. has grown steadil y from … to…..in 2009. has risen from …. shows a tendency to increase climbed went sharply up soared tends to go up b/ increase There was a rapid / sharp / dramatic / gradual / slow increase / rise in the number of …. who….. The number of …. is on the rise / increase.
图表作文(一) 第一节图表作文的类型 图表作文可分为两大类:表作文和图作文。 表作文 表格(Table)可以使大量数据系统化,便于阅读、比较。表格常由标题(Title)、表头(Boxhead)(表格的第一行)、侧目(Stub)(表格左边的第一列)和主体(Body)部分(表格的其余部分)等部分组成。如下表: 用表格表达的信息具体准确,而且表格中的各项均按一定规律排列。阅读表格时要注意找出表格中各个项目的相互关系,表格中各个项目的变化规律。例如,上面的表格中的数字说明,和1978年相比,1983年大学入学的人数在增加,而小学的入学人数在减少。搞清楚这些变化规律也就读懂了表格的内容。 图作文 图作文又可分为三种:圆形图作文、曲线图作文和条状图作文。 (1) 圆形图作文 圆形图(Pie chart)也称为饼状图或圆面分割图。圆形图因为比较形象和直观,各部分空间大小差别容易分辨,所以常用来表示总量和各分量之间的百分比关系。整个圆表示总量,楔形块表示分量。有时圆形图还有数值表,两者结合可把各分量表示得更准确、清楚。例如:This is a pie chart of the average weekly expenditure of a family in Great Britain. As can be see from the chart, the main expenditure of an average British family is spent on food, which accounts for 25% of its total expenditure. The next two significant expending items are transport and housing, which are 15% and 12% respectively. If we take into account clothing and footwear, which makes up 10%, the four essentials of life, that is, food, transport, housing, and clothing and footwear, amount to 62% of the total expenditure. (2) 曲线图作文 曲线图(Line graph)也称为线性图或坐标图。曲线图最适合表示两个变量之间关系的发展过程和趋势。一般来说,曲线所呈现的形状比某一点所代表的变量的值更有意义。曲线图有横轴和纵轴。一般先看横轴所代表的数量或时间等,然后再看纵轴所显示的意义。同时必须找出线条所反映的最高或最低的变化。例如: 这个曲线图的横轴代表1990年的不同的月份,纵轴代表交通事故的数量。从交通事故曲线图上可知,前八个月的交通事故的数量有升有降。曲线图在八月份升到了最高点(39),此后一直呈下降的趋势,十二月份降到了最低点(16)。可见,1990年的交通事故的数量总体上呈下降的趋势。 (3) 条形图作文 条形图(Bar graph)也称为立柱图或圆柱图。条形图由宽度相同但长度不同的条块代表不同的量。当要比较几个项目或量时,常用不同颜色来区分。条形图主要用来表示:1)同一项目在不同时间的量;2)同一时间不同项目的量。阅读条形图时,要先看图例,再看横轴、纵横各代表什么量,每一个刻度所代表的值是多少,最后找出图中各长条所表示的数据及各长条间的相互关系。例如: 左边的条形图的横轴代表时间,纵轴代表期望寿命(Life Expectancy),这一条形图想要体现的是同一项目(期望寿命)在不同时间的量。右边的条形图的横轴也是代表时间,纵轴是代表婴儿的死亡率(Infant Mortality),这一条形图想要体现的也是同一项目(婴儿的死亡率)在不同时间的量。左边的条形图表明1990年的人均期望寿命比1960年的人均期望寿命长20岁,而1990年的婴儿死亡率比1960年的婴儿死亡率下降了50%。