
Product Brochure
Spectrum Master?
MS2721B MS2723B MS2724B
9 kHz to 7.1 GHz 9 kHz to 13 GHz 9 kHz to 20 GHz
A High Performance Handheld Spectrum Analyzer
and Base Station Analyzer
2
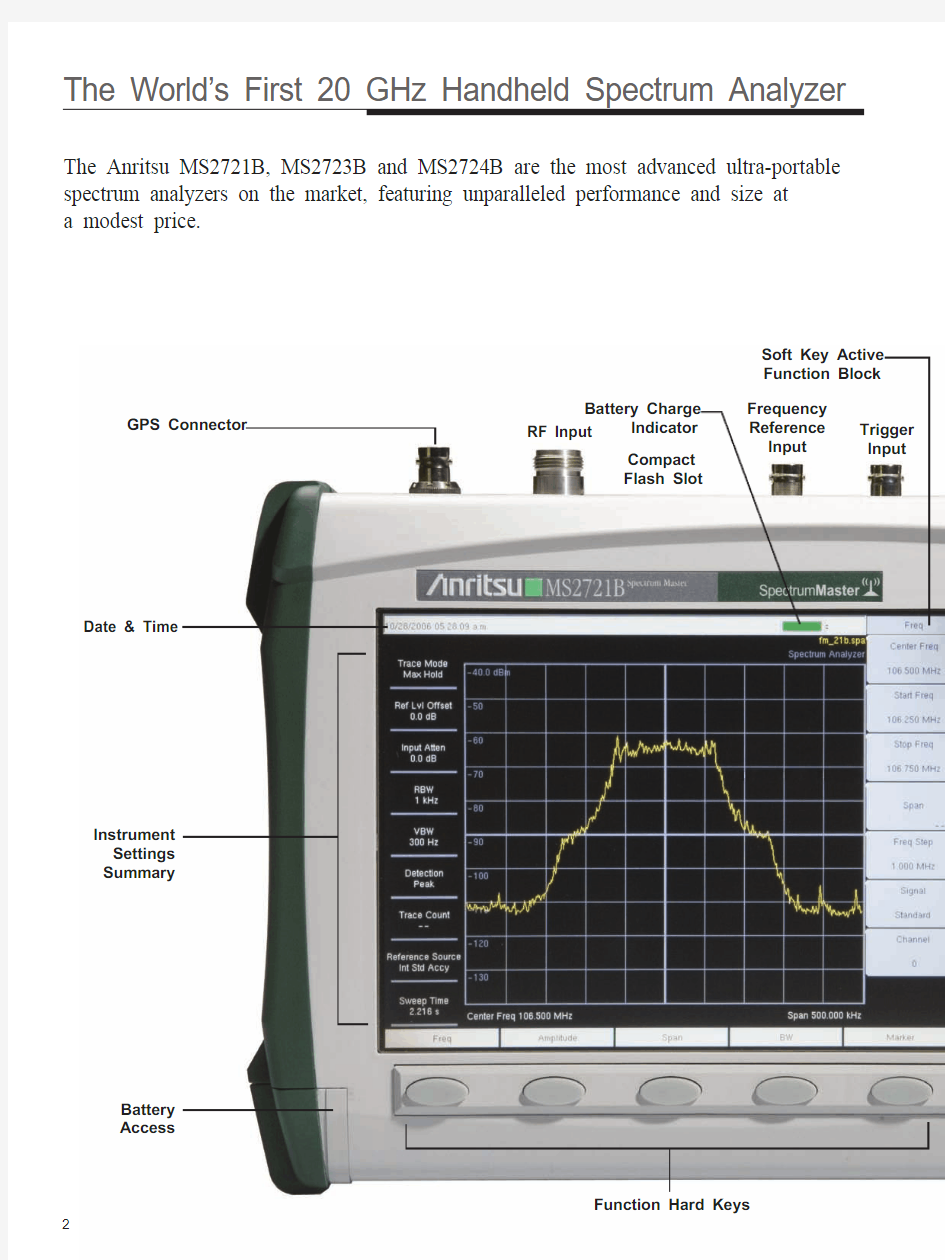
The Anritsu MS2721B, MS2723B and MS2724B are the most advanced ultra-portable spectrum analyzers on the market, featuring unparalleled performance and size at a modest price.
Soft Key Active Function Block
Battery Charge
Indicator GPS Connector
Compact Flash Slot
Date & Time
Trigger Input
Frequency Reference Input
RF Input
Instrument Settings Summary
Function Hard Keys
Battery Access
The World’s First 20 GHz Handheld Spectrum Analyzer
Unprecedented in handheld battery powered spectrum analyzers, the sensitivity of the Spectrum Master family delivers the ability to measure very low level signals. Coupled with a wide range of resolution bandwidth c hoices, you can configure the Spectrum Master to meet your most challenging m easurement needs.
As the spectrum becomes more and more congested, the ability to measure low level s ignals becomes more and more important not only for interference detection but also for wireless system planning.
Soft Keys
On/Off Button
USB Connector for Flash Drive
Directional Buttons
Dual Function
Keypad
Rotary Knob Headset 2.5 mm
Speaker
LAN Connector
Battery Charger Input
USB Device Jack
Tracking Generator
≤–153 dBm Displayed Average Noise Level
Typical @ 1 GHz
3
4
Operating convenience is of paramount importance when equipment is used in the field.
The input attenuation value can be tied to the reference level, reducing the number of parameters a field technician may have to set. The RBW/VBW and the span/RBW ratios can be set to values that are best for the measure-ments being made, further easing the technician’s burden and reducing the chances of errors.
Over 1000 traces with names up to 40 characters long may be saved
in the 256 MB non-volatile compact flash memory. These traces can later be copied into a PC using the built-in USB 2.0 connector or the 10/100 Mbit Ethernet connection. Measurements may also be saved directly to Compact Flash or USB Flash Drive.
Commonly needed measurements are built in. These include field strength, occupied bandwidth, channel power, adjacent channel power ratio, AM/FM/SSB demodulation and carrier to interference (C/I) ratio measurements.The Spectrum Master family has very wide dynamic range, allowing measurement of very small signals in the presence of much larger signals. These pictures show a measurement of a –114 dBm signal with and without the presence of a –22 dBm signal only 20 kHz away.
Measuring a Small Signal
W-CDMA/HSDPA Signal Analyzer
824 to 894 MHz Band V, VI
1710 to 2170 MHz Band I, II, III, IV 2300 to 2700 MHz W-CDMA/HSDPA Signal Analyzer
W-CDMA/HSDPA RF Meas W-CDMA Demod
W-CDMA/HSDPA Demod W-CDMA/HSDPA OTA
GSM/GPRS/EDGE Signal Analyzer
380 to 400 MHz T-GSM 380 410 to 430 MHz T-GSM 410 450 to 468 MHz GSM 450 478 to 496 MHz GSM 480 698 to 746 MHz GSM 710 747 to 792 MHz GSM 750 806 to 866 MHz T-GSM 810 824 to 894 MHz GSM 850 890 to 960 MHz GSM 900 880 to 960 MHz E-GSM 900 876 to 960 MHz R-GSM 900 870 to 921 MHz T-GSM 900 1710 to 1880 MHz DCS 1800 1850 to 1990 MHz PCS 1900GSM/GPRS/EDGE Signal Analyzer GSM/GPRS/EDGE RF Meas GSM/GPRS/EDGE Demod
GPS
Location Indicator
Enhance Frequency Reference Oscillator Accuracy
Wide Dynamic Range — Measuring a small signal in the presence of a very large signal
Field Use
Measurement flexibility is important for lab use. Resolution bandwidth and video bandwidth can be independently set to meet a user’s measurement needs. In addition the input attenuator value can be set by the user and the preamplifier can be turned on or off as needed.
For maximum flexibility, sweep triggering can be set to free run, or to do a single sweep. In zero span, the sweep can be set to trigger when a signal meets or exceeds a certain power level or it can be externally triggered.
The span can be set anywhere from 10 Hz to 7.1, 13, or 20 GHz in addition to zero span.
Using battery-powered equipment to measure powerline related sidebands on a signal source removes any question as to the source of the sidebands.
Powerline related sidebands on a synthe-sized signal generator
Continuous frequency coverage from 9 kHz to 20 GHz gives the wireless professional the performance needed for the most demanding measurements.
Whether your need is for spectrum monitoring, WiFi and WiFi5 installation and testing, RF and microwave signal
measurements or cellular signal measurements, the Spectrum Master family gives you the tools you need to make the job
easier and more productive. The built-in AM/FM/SSB demodulator simplifies the job of identifying interfering signals.
Typical MS2721B Phase Noise Performance
Typical MS2724B Phase Noise Performance
5
Lab Use
6
Light Weight
Weighing about seven pounds fully loaded, including a Li-Ion battery, this fully functional handheld spectrum analyzer is light enough to take anywhere, including up a tower.
AM/FM/SSB Demodulation
A built-in demodulator for AM, narrowband FM, wideband FM and single sideband (selectable US
B and LSB) allows a technician to easily identify interfering signals. The demodulated audio can be heard either through the built-in speaker or through a standard cellphone headset. A demodulation marker is provided for easy tuning.
Remote Tools
Imagine sitting at your desk while controlling an Spectrum Master that is miles away, seeing the screen display and operating with an interface that looks exactly like the instrument itself. That is what Remote Tools lets you do.
Local Language Support
The Spectrum Master features eight languages English, Spanish, German, French, Japanese, Chinese, Italian and Korean, two custom user-defined languages can be uploaded into the instrument using Master Software Tools, supplied with the instrument.
Fast Sweep Speed
The Spectrum Master automatically sets the fastest sweep consistent with accurate measurements, and sweep speed in zero span can be set from
10 microseconds up to 600 seconds. This is faster and more flexible than any portable spectrum analyzer on the market today, simplifying the capture of intermittent interference signals.
+43 dBm Maximum Safe Input Level
Because the MS2721B can survive an input signal of +43 dBm (20 watts) without damage, you can rest assured that the MS2721B
can survive in even the toughest RF environments. Maximum continuous input for measurement is +30 dBm. For the MS2723B and MS2724B the maximum safe input is +30 dBm.
Spectrum Monitoring
A critical function of any spectrum analyzer is the ability to accurately view a portion of the RF and microwave spectrum. The Spectrum Master performs this function admirably thanks to the wide frequency range and excellent dynamic range. A built-in 256 M
B compact flash memory module allows over 1,000 traces to be stored. The Compact Flash connector allows compact flash memory to expand the trace storage without limit. A 512 Mb compact flash module can hold over 13,000 spectrum analyzer sweeps. USB Flash Drives may be used for convenient transfer of data.
Limit Lines
The Spectrum Master includes two types of limit lines, lower limit lines and upper limit lines. Limit lines may be used either for visual reference or for pass/fail criteria by implementing limit alarms. Limit alarm failures are reported if a signal is above the upper limit line or below the lower limit line. Each limit line may consist of up to 40 segments.
AM, FM and SSB Demodulation
Multiple Language Support
Segmented Limit Lines
Features
Transmissive Color Display
The MS2721B, MS2723B and MS2724B 21.5 cm (8.5 in.) SVGA color transmissive LCD display screen is readable outdoors.
IF Output (Option 89) (MS2723B and MS2724B only)
Option 89 adds an IF Output connector to the instrument. The IF Output provides access to the 37.8 MHz IF signal at user selectable bandwidths of 16 MHz, 10 MHz, 7 MHz, or IF bandwidths corresponding to any of the selectable RBW filter bandwidths.
Multiple Markers
Display up to six markers on screen in Spectrum Analyzer mode each with delta marker. Or choose one reference marker with six delta markers. Noise marker and frequency counter marker can be selected. In W-CDMA/HSDPA mode the six markers can display the selected code power, code EVM and type of code.
Noise Markers
The capability to measure noise level in terms of dBm/Hz or dBμV/Hz is a standard feature of the Spectrum Master.
Frequency Counter Markers
The Spectrum Masters have frequency counter markers with resolution to 1 Hz. Add the GPS option to get complementary accuracy.
7
Multiple Markers simplify data analysis
such as on this CDP display.
Smart Measurements
The Spectrum Master family has dedicated routines for one-button measurements of field strength, channel power, occupied bandwidth, Adjacent Channel Power Ratio (ACPR) and C/I. These are increasingly critical measurements for today’s wireless communication systems. The simple interface for these complex measurements significantly reduces test time and increases analyzer usability.
Fast Sweep Speed
The Spectrum Master automatically sets the fastest possible sweep consistent with accurate measurements, and sweep speed in zero span can be set from 10 microseconds to 600 seconds. This is faster and more flexible than any portable spectrum analyzer on the market today, simplifying the capture of intermittent interference signals.
Carrier to Interference Measurement
As more 802.11 access points are installed, there is an increasing level of interference in the 2.4 GHz and 5.8 GHz bands occupied by this service and other devices such as cordless telephones. This measurement capability makes it simple for an access point installer to determine if the level of interference is sufficient to cause difficulty for users in the intended service area, and can show the need to change to another access channel. The wide frequency coverage of the Spectrum Master makes this the only spectrum analyzer you need to install and maintain 802.11a, 802.11b and 802.11g wireless networks.
8
Occupied Bandwidth
Lab Grade Spectrum Analysis in a Handheld Package
Occupied Bandwidth
This measurement determines the amount of spectrum used by a modulated signal. You can choose between two different methods of determining
bandwidth: the percent of power method or the “x” dB down method, where “x” can be from 1 dB to 100 dB down the skirts of the signal.
Adjacent Channel Power Ratio
A common transmitter measurement is that of adjacent channel leakage power. This is the ratio of the amount of leakage power in an adjacent channel to the total transmitted power in the main channel, and is used to replace the traditional two-tone intermodulation distortion (IMD) test for system non-linear behavior.
The result of an ACPR measurement can be expressed either as a power ratio or a power density. In order to calculate the upper and lower adjacent channel values, the Spectrum Master allows the adjustment of four parameters to meet specific measurement needs: main channel center frequency, measurement channel bandwidth, adjacent channel bandwidth and channel spacing. When an air interface standard is specified in the
Spectrum Master, all these values are automatically set to the normal values for that standard.
9
Interference Analyzer (Option 25)
With its built-in low-noise preamplifier, the Spectrum Master with
i nterference analyzer option provides the ability to identify and locate interfering signals down to the noise floor, allowing t echnicians t o better address the quality issues that affect user service.
Spectrogram
The Spectrogram display is a three dimensional display of frequency, power, and time of the spectrum. It is applicable for identifying intermittent interference and tracking signal levels over time. The Spectrum Master
can save data for up to 72 hours.
Signal Strength Meter
The Signal Strength meter locates an interfering signal by measuring the strength of the interfering signal. Power is displayed in Watts, dBm and in the graphical analog meter display. The strength of the signal is also indicated by an audible beep.
The Field Strength measurement is included to the Signal Strength Meter menu for quick determination of calibrated field strength.
With Option 25, spectrogram measurements identify intermittent interference.
With Option 25, RSSI analyzes the signal strength of a signal over time.
The Signal Strength Meter can be used to locate an interfering signal.
Extend the Functionality with Valuable Options
RSSI
The received signal strength indicator is useful to observe the signal strength of a single frequency over time. Data can be collected for up to 72 hours.
10
Channel Scanner (Option 27)
The channel scanner option measures the power of multiple transmitted signals and is very useful for measuring channel power in AMPS, iDEN, GSM, TDMA, CDMA, W-CDMA, and HSDPA networks. Up to 20 channels can be scanned at the same time. You can select to display the frequencies or the scanned data, to be displayed by frequencies or the channel number. Display data in graph or table format. In the custom setup menu each channel can be custom built with different frequency, bandwidth, or channels from different signal standards.
Gated Sweep (Option 90)
This option will be of interest to those who want the capability to view pulsed or burst signals only when they are on, or conversely look at the spectrum only when the signals are off. The signals may be such things as radar signals, WiMAX signals, TD-SCDMA, and GSM signals.
Gated sweep uses the external trigger input to begin sweeping when the trigger signal goes to the user-selected TTL high or TTL low. After the trigger event has occurred, the instrument will sweep for the time specified by the Gate Length parameter and then wait for further trigger events before continuing the sweep. This repeats until enough trigger conditions occur to finish the full sweep. The user can also enter a gate delay value to have sweeping start at the end of the delay. This allows the user to compensate for cases where the trigger signal occurs before the RF event they want to
measure.
With Option 27, channel scanner measures power of multiple transmitters.
With Option 90, display setup showing off
time of a WiMAX signal.
With Option 90, gated sweep display setup. WiMAX header
Extend the Functionality with Valuable Options
Signal ID
The Signal ID feature in the interference Analyzer can help to quickly identify the type of the interfering signal. This measurement can be config-ured to identify all signals in the selected band or just monitor one single interfering frequency. The results displayed include the Center Frequency, Bandwidth of the signal, the type of the signal (CDMA, GSM and
WCDMA); its closest channel number, the number of carriers, its Signal to Noise ratio and the Channel Power of the signal. The spectrum of the signal
is colored to ease review of the scanned signals.
the whole band.
a particular frequency.
11
With GPS Option 31, the location informa-tion (longitude, latitude) is shown at the top of the screen.
With GPS Option 31, enhance the frequen-cy reference oscillator accuracy to make
accurate frequency error measurements.
GPS (Option 31)
GPS information allows confirmation of the correct measurement
location. The GPS option provides exact location information (longitude, latitude) which is saved with each measurement in addition to date and time. Included with the GPS option is a magnet mount antenna with a 5m (15 feet) cable allowing use on a car roof or other useful surface.
The GPS Option also enhances the frequency accuracy of the
Spectrum Master’s internal OCXO oscillator. Within three minutes of GPS satellite acquisition, the built-in GPS receiver provides a frequency accuracy to better than 25 ppb (parts per billion). After the GPS antenna is disconnected, the instrument will remain in High-Accuracy mode for three days, preserving frequency accuracy to better than 50 ppb.
D r i f t i n P P B
One hour at each individual temperature (x-axis)
D r i f t i n P P B
One hour at each individual temperature (x-axis)
Typical frequency accuracy of the Spectrum Master for 24 hours fol-lowing the GPS antenna disconnect over temperature range 15° C to 35° C.
Typical frequency accuracy of the Spectrum Master for 72 hours fol-lowing the GPS antenna disconnect over full specified temperature range.
MS2724B Spectrum Master
Enhance Frequency Accuracy with Built-in GPS
12
With four measurement options — W-CDMA/HSDPA RF Meas,
W-CDMA Demod, W-CDMA/HSDPA Demod (covering all W-CDMA Demod measurements) and W-CDMA/HSDPA Over The Air (OTA) measurements — technicians and RF engineers can connect the Spectrum Master to any Node B for accurate RF and demodulator measurements. A physical connection is not required for the instrument to receive and
demodulate W-CDMA and HSDPA OTA signals. With a Spectrum Master, a technician no longer needs to take a Node B site off line. For details see the Option Comparison Table on page 29.
W-CDMA/HSDPA
RF Measurements (Option 44)
RF measurements are used to measure the transmitted signal strength and signal shape of the selected Node B transmitter. For the technician’s convenience, the RF measurement option includes Band Spectrum, Channel Spectrum, Spectral Emission Mask, ACLR and RF Summary screens.
Band Spectrum
Select the applicable signal standard downlink spectrum, place a cursor on the desired channel, and the unit automatically selects that channel to make W-CDMA/HSDPA measurements.
Channel Spectrum
The Channel Spectrum screen displays the signals of a selected channel as well as channel power (in dBm and watts), occupied bandwidth and peak to average power. Operators can select a channel by using the band channel or by choosing a signal standard and channel.
Spectral Emission Mask
The Spectral Emission Mask measurement applies the mask depending upon the transmitter output as defined in the 3GPP specification (TS 125.141). The mask varies depending upon the input signal. The Spectrum Master will indicate if the signal “PASSED” or “FAILED” according to the specified limits. For ease of analysis, the spectral emission mask is also displayed in a tabular format with different frequency ranges and a PASS or FAIL indica-tion for each range.
ACLR
The Spectrum Master’s ACLR screen shows measurements of main channel power as well as the power levels of the adjacent channels set at –10 MHz, –5 MHz, +5 MHz and +10 MHz according to the 3GPP standard (TS 125.141). The Spectrum Master can also make multichannel ACLR measurements with as many as four main channels and four adjacent channels. See the example with four main channels and two adjacent channels on both sides.
RF Summary
The RF Summary screen displays the transmitter performance p arameters in
a table format so technicians can quickly check details at a glance.
The RF Spectrum screen shows selected signals along with key parameters, such as channel power and occupied bandwidth.
The ACLR screen shows the power levels for the main channel as well as two adjacent channels.
Multi-channel ACLR with four main channels and two adjacent channels on both sides.
The Spectral Emission Mask screen pres-ents a received signal framed by the 3GPP
spectral mask.
Node B Transmitter Performance Testing Made Simple
13
Pass/Fail Mode
The Spectrum Master stores the five test models covering all eleven test scenarios specified in the 3GPP specification (TS 125.141) for testing base station performance and recalls these models for quick easy measurements. After an operator selects a test model, the Spectrum Master displays test results in table format with clear PASS or FAIL indications that include min/max thresholds and actual measured results.
Using Master Software Tools, additional custom tests can be easily
created and uploaded into the Spectrum Master. All critical parameters can be selected for pass/fail testing including each individual code’s power level,
the spreading factor and symbol EVM.
The Code Domain Power (CDP) screen shows 256 or 512 OVSF codes with flexible zoom capabilities.
The Modulation Summary screen shows critical transmitter performance parameters in table format.
The Codogram screen shows how code levels are changing over time to simplify fault analysis.
The Spectrum Master offers a clear Pass/Fail display for quick evaluation of a Node B base station.
Connect Directly or Over the Air
W-CDMA Demodulator (Option 45)
The Spectrum Master with Option 45 demodulates W-CDMA signals and displays detailed measurements for evaluating transmitter modulation performance using Code Domain Power (CDP), Codogram, Modulation Summary and Pass/Fail screens. All the capability of Option 45 is included in Option 65.
Code Domain Power
The Code Domain Power (CDP) screen displays 256 or 512 OVSF codes with zoom capability, common pilot power (P-CPICH), channel power, error vector magnitude (EVM), carrier frequency, carrier feed through, frequency error (in Hz and ppm), Peak CD error, and noise floor. Option 45 can zoom to 32, 64, or 128 codes and the user can input the zoom code to zoom in on the OVSF codes. The demodulator also displays CPICH, P-CCPCH, S-CCPCH, PICH, P-SCH and S-SCH power in a dedicated control chan-nel view.
Codogram
The Codogram screen displays how code levels are changing over time, making it easier to monitor traffic, faults and hand-off activity. Showing 256 or 512 OVSF codes with zoom codes, the Spectrum Master can zoom to 32, 64 or 128 codes, or the user can directly zoom to particular OVSF codes of interest.
Modulation Summary
The Modulation Summary screen displays critical transmitter p erformance measurements in table format for easy viewing, showing carrier frequency, frequency error, channel power, primary common pilot channel (P-CPICH) absolute power, secondary common pilot channel (S-CCPCH) power and paging indicator channel (PICH) as well as physical shared channel (PSCH) absolute power.
14
W-CDMA/HSDPA Demodulator (Option 65)
High Speed Downlink Packet Access (HSDPA) uses up to fifteen dedicated physical channels to provide high downlink data rates. The Spectrum Master with Option 65 allows demodulating HSDPA signals and displaying CDP, selected code power variation over time, and the constellation for the selected code, in addition to all the standard W-CDMA demodulator measurements that are included in Option 45.
W-CDMA/HSDPA Over The Air (OTA) (Option 35)
OTA displays six scrambling codes in a bar graph format. For each scrambling code, CPICH in dBm, Ec/Io in dB, Ec in
dBm, and pilot dominance in dB are displayed in table format. The user will also see OTA total power in dBm.
With Option 65, the Spectrum Master demodulates HSDPA and W-CDMA signals and displays selected code constellation. The selected code power versus time is also displayed.
With Option 35, the Spectrum Master shows six scrambling codes and CPICH
data in a combination bar graph/table view.
Demodulate and Display HSDPA Signals with Ease
15
Option 40 displays the first detected timeslot mask as specified in 3GPP
TS 05.05.
Option 41 demodulates and displays GSM/GPRS/EDGE signals, including
vector diagrams.
Option 41 provides a quick, table view of critical test p arameters, including channel power, occupied bandwidth, phase error
and EVM.
Using Master Software Tools, custom GSM/GPRS/EDGE Pass/Fail test sets can be created and uploaded to the Spectrum Master.
Demodulate GSM, GPRS and EDGE Signals
Pass/Fail Mode
Using Master Software Tools, custom GSM/GPRS/EDGE Pass/Fail test sets can be easily created and uploaded into the Spectrum Master. The test results are displayed in table format with clear pass or fail indicators that include min/max thresholds and actual measured results.
GSM/GPRS/EDGE Measurements
For flexibility, the Spectrum Master features two GSM/GPRS/EDGE measurement modes: RF Meas and Demod. Technicians and RF engineers can connect the unit to any GSM/GPRS/EDGE base station for accurate RF and demodulator measurements. When a physical connection is not required, the unit can receive and demodulate GSM/GPRS/EDGE signals over the air.
GSM/GPRS/EDGE RF Measurements (Option 40)
GSM/GPRS/EDGE RF measurements provide views of single-channel spectrum, multichannel spectrum, power versus time (frame), power versus time (slot) with mask per 3GPP TS 05.05 specification and summary screens.
The spectrum view displays channel spectrum and multichannel spectrum. The channel spectrum screen includes channel power, burst power, average burst power, frequency error, modulation type and Training Sequence Code (TSC). The multichannel spectrum allows the user to show as many as ten channels with measurements displayed for the selected channel.
GSM/GPRS/EDGE Demodulator (Option 41)
Option 41 demodulates GSM/GPRS/EDGE signals and displays the results of detailed measurements to analyze transmitter modulation performance. Results are shown for phase error (rms), phase error peak, EVM (rms), EVM (peak), origin offset, C/I, modulation type and magnitude error (rms) and a vector diagram of the signal.
16
CDMA RF Measurements (Option 42)
RF Measurements are used to measure the transmitted signal power, shape, power in adjacent channels and spurious
emissions. The following sets of measurements help the technician evaluate the RF characteristics of a CDMA base station.
Connect Directly or Over the Air to Make CDMA/
EVDO Measurements
CDMA Channel Spectrum measurement display
CDMA Spurious Emissions measurement display
cdmaOne and CDMA2000 1xRTT Demodulator (Option 43)
Demodulator measurements are used to measure the code domain power in both graphical and tabular forms.
The following sets of measurements help the technician evaluate the quality of the modulation from the CDMA base station.
Evaluate the Quality of the Modulation
from the CDMA Base Station
CDMA Code Domain Power measurement display
Channel Spectrum
The Channel Spectrum measurement displays the spectrum of the specified channel in addition to numerical values for Channel Power, Occupied BW and Peak to Average Ratio.
ACPR
The ACPR measurement displays the main channel and the power of two adjacent channels on each side of a bar graph. The user can configure up to five main channels.
Spurious Emission
This measurement displays the spectrum of the input signal at specific
offsets (based upon the Signal Standard). Markers are automatically tuned to measure the input power at these offsets and to determine a PASS or FAIL according to limits that are set by the signal standard. A blue mask is also calculated and shown on the spectrum to visually check for pass fail conditions.
CDP
The Code Domain Power measurement displays the power of the various
demodulated codes (display is automatically bit reversed if Walsh Codes are set to 128). Rho, Frequency Error, Average Noise Floor and Tau are numerical values that are calculated and displayed. A zoom view of 16, 32 or 64 codes is also seen. Markers can be turned on to display the code power and code type.
CDP Table
This measurement displays all the active codes in a color coded tabular format..
17
EVDO
With the 3G evolution of CDMA technology, 1xEV-DO provides data rates up to 2.4 Mbps, providing greater system capacity and lower costs, making wireless broadband possible. The CDMA2000 1xEV-DO (EVDO) system is backward compatible and is spectrally identical to the cdmaOne and CDMA2000 systems.
EVDO RF Measurements (Option 62)
RF Measurements are used to measure the transmitted signal power, shape, power in adjacent channels and spurious emissions. The following sets of measurements help the technician evaluate the RF characteristics of an EVDO base station.
EVDO Power vs. Time measurement display
cdmaOne and CDMA2000 1xRTT Over The Air (Option 33)
Over The Air Measurement provides a cost effective way to identify base station performance problems before they
become catastrophic without taking the base station off the air. Traditionally, technicians had to bring down the sector or site to test the base station performance. Now technicians can sit in a vehicle and make these measurements. For accurate measurements over the air, a GPS antenna should be used to provide a timing reference.
Optimize EVDO Network Performance
Evaluate the Quality of the Modulation
from the CDMA Base Station
CDMA Over the Air measurement display
Pilot Scan
The strongest nine received PNs are displayed as bar graphs, and the PN numbers are displayed at the bottom of the bar graphs. For each PN, a table displays PN number, Ec/Io, and Tau. Also shown are Pilot Power, Channel Power, and Pilot Dominance.
MultiPath
The strongest six paths are displayed. For each path, a table below the bar graph displays Ec/Io and Tau. Also shown are Channel Power and Multipath Power.
Channel Spectrum
The Channel Spectrum measurement displays the spectrum of the specified channel in addition to numerical values for Channel Power, Occupied BW and Peak to Average Ratio.
Power vs Time
This measurement displays the time domain view of an EVDO
half-slot and helps determine the % of idle activity which gives a measure of how many users are connected to the base station.
ACPR
The ACPR measurement displays the main channel and the power of two adjacent channels on each side of a bar graph. The user can configure up to five main channels.
Spurious Emission
This measurement displays the spectrum of the input signal at specific offsets (based upon the Signal Standard). Markers are automatically tuned to measure the input power at these offsets and to determine a PASS or FAIL according to limits that are set by the signal standard. A blue mask is also calculated and shown on the spectrum to visually check for pass fail conditions.
18
EVDO Over The Air (Option 34)
Over The Air Measurement provides a cost effective way to identify base station performance problems before they become catastrophic without taking the base station off the air. Traditionally, technicians had to bring down the sector or site to test the base station performance. Now technicians can sit in a vehicle and make these measurements. For accurate measurements over the air, a GPS antenna should be used to provide a timing reference.
Pilot Scan
The strongest nine received PNs are displayed as bar graphs, and the PN numbers are displayed at the bottom of the bar graphs. For each PN, a table displays PN number, Ec/Io, and Tau. Also shown are Pilot Power, Channel Power, and Pilot Dominance.
MultiPath
The strongest six paths are displayed. For each path, a table below the bar graph displays Ec/Io and Tau. Also shown are Channel Power and
Multipath Power.
Pass/Fail Mode
The Spectrum Master can perform automated Pass/Fail testing for both CDMA and EVDO. The test results are displayed in table format with
clear PASS or FAIL indications that include min/max thresholds and actual measured results. Using Master Software Tools, custom tests can be easily created and uploaded into the unit. All critical parameters can be selected for Pass/Fail testing.
EVDO Demodulator (Option 63)
Demodulator measurements are used to measure the code domain power in both graphical and tabular forms. The following sets of measurements help the technician evaluate the quality of the modulation from the EVDO base station.
CDP MAC
This measurement displays the power of the various demodulated codes in the MAC Channel. Pilot and MAC Power, Rho, Frequency Error, and Average Noise Floor are numerical values that are calculated and displayed. A zoom view of 16, 32 or 64 codes is also seen. Markers can be turned on to display the code power and code type.
CDP Data
This measurement displays the power of the 16 I and 16 Q sub-channels of the Data channel separately.
MAC CDP Table
This measurement displays all the active codes in the MAC channel in a color coded tabular format.
Evaluate the Quality of the Modulation
from the CDMA Base Station
EVDO CDP MAC measurement display
Cost Effective Way to Identify Base Station
Performance Problems
EVDO Over the Air measurement display
EVDO Pass Fail Mode measurement display
Fixed WiMAX Measurements Made Simple
The Fixed WiMAX 802.16-2004 specification refers to an air interface standard for Broadband Wireless Access systems.
It enables multiple services in a wireless metropolitan area network, such as wireless backhaul for telecommunications, E1/T1 replacement for small and medium businesses and residential wireless cable/DSL for broadband internet at home. Also, WiMAX provides fixed, nomadic, portable and mobile wireless broadband connectivity without the need for a direct line-of-sight connectivity between a base station and a subscriber.
Fixed WiMAX provides two measurement options: Fixed WiMAX RF Meas and Fixed WiMAX Demod. So for accurate RF and demodulator measurements, technicians and RF engineers can connect the Spectrum Master to any Fixed WiMAX Base Station.
Fixed WiMAX RF Measurements (Option 46)
RF measurements are used to measure the transmitted signal strength and signal shape of the selected BTS transmitter. For the technician’s convenience, the RF measurement option can display Channel Spectrum, Power vs. Time, ACPR
and RF Summary screens.
The RF Spectrum screen shows the signal
spectrum along with key parameters, such
as channel power and occupied bandwidth. Power vs. Time screen displays the burst
power and preamble power of the signal.
The ACPR screen shows the power levels for the main channel and two adjacent channels.Power vs. Time
The Power vs. Time screen shows the time domain view of a Fixed WiMAX OFDM signal. The Preamble power is always 3 dB higher than the data power. The channel power, preamble power, burst power of data bursts in dBm and the Crest Factor are displayed as numerical values.
Spectrum
In the Spectrum screen, technicians can view and examine the selected signal’s channel power (in dBm) and occupied bandwidth.
ACPR
ACPR is the ratio of the amount of leakage power in an adjacent channel to the total transmitted power in the main channel. Technicians can easily inspect measurements of main channel power as well as the power levels of the two adjacent channels on each side.
19
20
Fixed WiMAX Demodulator (Option 47)
With Option 47, the Spectrum Master can demodulate Fixed WiMAX OFDM signals and displays detailed measurements for
evaluating transmitter modulation performance using Constellation, Spectral Flatness, EVM vs. Sub carrier, and EVM vs. Symbol.
Option 47 displays the constellation of the
demodulator signal.
Spectral Flatness is displayed with the mask as specified in 802.16-2004.
Demodulate Fixed WiMAX Signals with Ease
Spectral Flatness
The Spectral Flatness view displays the data collected from the preamble before channel estimation is performed. The deviation of the spectral flatness from the average over all the carriers is shown in dB. A mask that conforms to the 802.16-2004 specification is displayed as green/red lines depending on the measurement value. The absolute delta of the power between adjacent sub carriers in dB is also displayed.
Constellation
The Constellation view shows the constellation of the demodulated data symbols over 1 frame. The data bursts can have BPSK, QPSK, 16 QAM or 64 QAM modulations. All the modulations are color coded. The screen also displays RCE (rms) in dB, RCE (pk) in dB, EVM (rms) in %, EVM (pk) in %, Freq Error in Hz, Freq Error in ppm, Carrier Frequency in Hz and Base Station ID.
1 PCTEL扫频仪相关介绍 本部分主要是这对ASPS所需数据通过PCTEL SeeGull扫频仪获取时,对应扫频仪如何正常设置、安装以及对应测试模式的设置,文件的导出。适用于SeeGull扫频仪TD-LTE系列产品。 PCTEl用于路测数据采集的软件称为“SeeHawk”。在本手册中,我们主要是借用“SeeHawk”前台数据采集部分,来说明SeeGull扫频仪如何使用。本手册以下章节中如无特别说明,所述内容均适用于全系列SeeGull扫频仪产品。 1.1 支撑型号 支持ASPS所需的TOPN测试机制的及相应文件输出的PCTEL扫频仪的型号如下:MX SeeGull TD-LTE全频段扫频仪 不同型号的扫频仪上报能力上存在较大差异。 1.2 测量所需设备 需要准备的设备与备附件: 1、笔记本电脑 2、SeeGull 扫频仪 3、SeeHawk软件 4、扫频仪射频接收天线和GPS天线 5、TD-LTE数据线(USB线缆) 6、扫频仪AC/DC电源适配器 1.3 测量前准备工作 1、将TD-LTE射频天线连接到扫频仪前面板的RF端口,连接USB端口数据线至电脑 USB接口。 2、连接GPS天线到GPS端,将天线置于车顶。 3、接通设备电源,按扫频仪面板的power 开关。 4、USB端口处的指示灯橘红色闪烁表示扫频仪供电正常,设备与电脑还未接通。 5、按照电脑提示安装设备驱动程序,指示灯逐个变成绿色,扫频仪处于开工状态。 6、在测试电脑上完成SeeHawk安装。
1.4 软件的安装及配置 1.4.1 系统需求 为了使系统可靠运转,保证系统的性能要求,安装时务必保证系统具有以下配置。 硬件配置 CPU:奔腾Inel Core2 Duo,2.33G及以上 内存:1G及以上 硬盘: 80G及以上 软件配置 操作系统:Windows XP 专业版;Windows 7专业版 运行环境要求 在SeeHawk运行过程中,请关闭所有的杀毒软件、防火墙软件,避免这些软件对USB 通信的干扰。 1.4.2 软件安装 软件安装环境检测 浏览光驱内的文件,打开文件夹找到应用文件,双击该应用文件运行安装程序,开始软件的安装:
纵观收音机电路,其组成莫过于放大器和各种滤波器者。由于它要处理各种频率之信号,需要的频率比如中频信号和正在接收的某个频率信号,要让它们以最小的阻碍通过并根据需求进行放大,对于不需要的频率譬如不是想要接收的空中传输的各个发射台信号,收音机自身由于混频,交调,器件之非线性等所产生的各种新频率信号要为之设置最大的阻碍不许它们进入放大器。一部优秀的收音机他的接收部分中的滤波器件对这些个各种频率的电信号的那绝对是爱憎分明的;如果收音机中相应的滤波器对待敌我频率的阶级立场不够坚定,那它决不会是一只好鸡。那么怎样才能知道我们的收音机对他要的信号足够友好,而又对他不该要的信号有足够的抵制能力涅?科学家们搞了个叫做啥“扫频仪” 的玩意儿专门来查看,当然不光是查看而已,还可以一边调整机机里面的滤波器件(主要是那些俗称中周的家伙),一边用这个东西来实时监视调整过程中的达到的效果,直到使我们满意为止。扫频仪何能何德有如此之能力?原来他自身能够产生一定频率范围内的所有信号,包括收音机需要的和应该要强加抵制的。这些个频率的信号由低到高(当然如果你喜欢也可以由高到低的干)的挨个儿的扫过去,故得扫频仪之名也。这些从扫频仪出来的扫频信号,虽然频率不一样,但个头大小可是完全相等的,它们进入一个正常的收音机后,该滤的滤掉,该放大的放大,最后可真是几家欢喜几家愁了,机机认为需要的信号被放大了N 多倍,不需要的信号自然就被衰减到一个很小的值了。扫频仪再由专门的探头去挨个儿察看经过机机的各个频率信号之大小,把这些大小值以频率为横轴,幅值之大小为纵轴,在显示屏上画出一个连续的曲线,我们只要一看到这个曲线马上就知道在扫频范围内不同频率的通过状况,再看看是不是我们想要的那个样子。 国产扫频仪的开山鼻祖当属变态三(BT-3),电子管的,那个头绝对的威猛,据说里面用了好多颗6N11的电子管,好东西来的,新的6N11可能40元RMB 一颗也未必买到,我三天的饭钱也没这么多涅!这位老大后来可是儿孙满堂,晶体管版的,集成版的,,统一的再在后面加字母以示辈分之高低,如BT-3B,BT-3C,BT-3H等等等等。这种通用的扫频仪并非针对收音机,中心频率多在1-300M,扫频范围最小大约到几百个千赫,主要是牛逼的人士用来玩电视机的,对付收音机的调频基本还算凑合,对调幅可能就不怎么灵了,为此咱特的搞了个中频图示仪,专仪专用,AM 的,FM 的,大约还有其他的很多我没听说过的。还是我们一衣带血的睦邻,日本帝国的人民能干,专门搞了些特地用来干收音机的扫频仪,在收音机界最有名的大约就是目黑MSW-7125A 了,据说当时俺们收音机厂们可是花了好多万一套从他们那买了好多好多,现在大把的收音机厂关的关,转的转,于是这些个曾经辉煌的目黑MSW-7125A 们就有好多流落到我们这些成天不务正业的家伙手里,价钱几千就能搞到,风闻最初有八九千一台涅,上回鸟坛有人搞到一批卖二千一台,买者如潮涌,后来又有说这批仪器有些些问题云云,不得而知。我因一时心血来潮遂网罗各地二手仪器商信息终于某日以我自己认为的高价和二手仪器商认为的极低价二千五百现大洋获此MSW-7125A 一只,向本坛昭示本鸟将彻底告别摸黑年代,全面进入到崭新的目黑年代(全体起立,热烈鼓掌十分钟。双手向空中下按以示安静——掌声渐渐稀落)。 购仪过程中曾得到无锡tomcat 王老师的热情指导,在此表示感谢!得意之余,未免有卖弄之欲望,故著此说也。 本使用指南全面参考了红灯大师的大贴题曰“目黑meguro 7125A说明 书.(Thanks for Mr.Pentax007)'的使用说明,链接:
MHDD使用方法以及图文教程(附带MHDD4.6光盘版和DOS版下载) MHDD软件简介 MHDD 是一款由俄罗斯人所开发的免费硬盘实体扫描维护程序,比起一般的硬盘表层扫描,MHDD 有相当令人激赏的扫描速度,让使用者不再需要花费数个小时来除错,只需几十分钟,一颗 80G 大小的硬盘就可以扫瞄完成,且 MHDD 还能够帮使用者修复坏轨,让使用者能够继续延续该硬盘的生命余光。此外, MHDD 还能够对硬盘进行低阶清除的动作,让想要卖掉硬盘的你不必担心硬盘中的数据被接手的买家回复盗用的困扰喔!官方所提供的 MHDD 可分为磁盘版与光盘版两种,如果使用者需要光盘版的话,要用刻录机烧录成光盘后使用。 简洁教程:(MHDD详细图文教程地址 https://www.doczj.com/doc/b46816427.html,/thread-1161-1-1.html) 1、进入MHDD后,按shift+F3扫描端口上的硬盘,制作的这个光盘版启动后自动扫描硬盘; 2、选择要检测硬盘的对应序号并回车; 3、按一下F4进入扫描设置,再按一下F4开始扫描。默认的只是扫描不修复. 4、扫描完毕之后,在/MHDD/LOG下有个MHDD.LOG,是扫描生成的日志文件。在光盘里,已经集成https://www.doczj.com/doc/b46816427.html,在/MHDD目录里面,可以输入EDIT打开文本编辑器,然后定位到/MHDD/LOG/MHDD.LOG,查看扫描结果,并采取下一步措施; 5、如果在按下F4没有反应的时候,可以从新光盘启动,运行一次/MHDD目录下的FBDISK,按ESC退出返回到DOS再输入MHDD,启动MHDD 4.6,这时候MHDD就能正常扫描了,这应该是软件的一个BUG; 6、在MHDD里输入man en all可以查看详细的帮助,输入help只是简短的帮助。《MHDD》工具使用详解与命令解释 1、MHDD是俄罗斯Maysoft公司出品的专业硬盘工具软件,具有很多其他硬盘工具软件所无法比拟的强大功能。 2、MHDD无论以CHS还是以LBA模式,都可以访问到128G的超大容量硬盘(可访问的扇区范围从512到137438953472),即使你用的是286电脑,无需BIOS支持,也无需任何中断支持; 3、MHDD最好在纯DOS环境下运行;中国硬盘基地网 https://www.doczj.com/doc/b46816427.html, 4、MHDD可以不依赖于主板BIOS直接访问IDE口,但要注意不要使用原装Intel品牌主板; 5、不要在要检测的硬盘中运行MHDD;中国硬盘基地网 https://www.doczj.com/doc/b46816427.html, 6、MDD在运行时需要记录数据,因此不能在被写保护了的存储设备中运行(比如写保护的软盘、光盘等); MHDD命令详解 EXIT(热键Alt+X):退出到DOS。 ID:硬盘检测,包括硬盘容量、磁头数、扇区数、SN序列号、Firmware固件版本号、LBA 数值、支持的DMA级别、是否支持HPA、是否支持AAM、SMART开关状态、安全模式级别及
一 机器启动 光谱仪启动时注意事项: (1)光谱仪两次开机之间至少应相隔20min ,以防频繁启动烧毁内部元器件 (2)光谱仪背面有5个开关,开机时按照编号1~5依次按下,两开关按下之间应相隔20s 左右。关机时,按照编号5~1依次按下。 图 光谱仪开关 (3)打开氩气阀,使气压保持在0.2~0.4MPa 之间 (4)维持瓶内气压在2~3MPa 以上,若气压低于该值,则应更换新的氩气 二 登陆 1、开机 开机用户名:arlservice 密码:369852147 2、进入OXSAS 系统 账号:(1)!SERVICE! 密码:ENGINEER (2)!MANAGER ! 密码:无 (3)!USER ! 密码:无 通常使用“MANAGER ”权限即可 3、检查仪器状态 快捷键F7进入仪器状态检查界面: Electronic HUPS Mains Vacuum Water 权限:由高到低
VACUUM:真空度 SPTEMP:真空室温度 MAINS:电源电压 NEG-LKV:-1000V电源 POS.5V:+5V电源 POS.12V:+12V电源 NEG.12V:-12V电源 POS.24V:+24V电源 NEG.100V:-100V电压 三数据备份及数据恢复 数据备份及恢复分为软件内部操作、软件外部操作。 1、数据备份 (1)软件内部备份:操作页面中选择“脱机模式”,待页面变灰后点击“备份数据”按钮,输入相应的文件名(例如:20101019OXSAS_DB.BAK)以防止将先前数据覆盖,然后点击备份即可。 (2)软件外部备份:退出OXSAS操作系统,进入其相应的数据备份及恢复程序“OXSAS Full Backup Restore”,然后选择“备份数据库”按钮下的“备份”选项即可(系统自动选择路径并生成相应文件名)。 2、数据恢复 (1)软件内部恢复:操作页面中选择“脱机模式”,待页面变灰后点击“恢复数据库”按钮,选择之前备份的数据库,恢复即可。 (2)软件外部恢复:退出OXSAS操作系统,进入其相应的数据备份及恢复程序 “OXSAS Full Backup Restore”,然后点击“恢复数据库”按钮,选择相应数据库,点击“RESTORE”即可。
频率特性测试仪及其应用第六章 应保持输入到被测在整个测量过程中,早期频率特性的测量用逐点测绘的方法来实现。就可以在坐标根据所得到的数据,网络信号的幅度不变,记录不同频率下相应输出的电压,而且有可能因测显然,这种方法不仅操作繁锁、费时,纸上描绘出该网络的幅频特性曲线。量频率间隔不够密而漏掉被测曲线上的某些细节,使得到的曲线不够精确。然后用示波器来显示信号通过被测扫频测量法是将等幅扫频信号加至被测电路输入端,在示波器屏幕上可直接显示出被测由于扫频信号的频率是连续变化的,电路后振幅的变化。电路的幅频特性。 (扫描信号)通用电子扫频信号扫描电压示波器发生器发生器X(扫频Y信号)峰值被测电路检波器 图6-1 扫频法测量电路的幅频特性 扫频测量法的仪器连接如图6-1所示。扫描电压发生器一方面为示波器X轴提供扫描信号,一方面又用来控制等幅振荡的频率,使其产生按扫描规律频率从低到高周期性重复变化的扫频信号输出。扫频信号加至被测电路,其输出电压由峰值检波器检波,以反映输出电压随频率变化的规律。 扫频法利用扫描电压连续自动地改变频率,利用示波器直观地显示幅度随频率的变化,与点频测量法相比较,由于扫频信号频率是连续变化的,不存在测试频率的间断点,因此不会漏掉突变点,且能够观察到电路存在的各种冲激变化,如脉冲干扰等。调试电路过程中,可以一边调整电路元件,一边观察显示的曲线,随时判明元件变化对幅频特性产生的影响,迅速查找电路存在的故障。扫频仪又称频率特性图示仪,这是将扫频信号源及示波器的X-Y显示功能结合为一体,并增加了某些附属电路而构成的一种通用电子仪器,用于测量网络的幅频特性。 一、扫频仪的基本工作原理 扫频仪的原理方框图如图6-2所示。 扫描电压发生器产生的扫描电压既加至X轴,又加至扫频信号发生器,使扫频信号的频率变化规律与扫描电压一致,从而使得每个扫描点与扫频信号输出的频率有一一对应的确定关系。扫描信号的波形可以是锯齿波,也可以是正弦波,因为光点的水平偏移与加至X轴的电压成正比,即光点的偏移位置与X轴上所加电压有确定的对应关系,而扫描电压与轴相应地成为频率坐标轴。X扫频信号的输出瞬时频率又有一一对应关系, 故.
德国BRUKER公司 Q4TASMAN直读光谱仪用户使用手册
仪器正面视图 仪器日常分析的所有操作均可通过仪器正面的操作按钮实现,由于仪器的简洁以及人性化设计,使得Q8的操作变得异常简单 火花台 火花台是用于样品检测过程中放置样快的地方,Q8的火花台包括: ●气动样品夹,针对不同形状样品,上方固定针可垂直放置或倾斜放置; ●火花台板及火花开口以及下电极。 操作按钮 在Q4仪器正面面板上有三个操作按钮: ?O形图案按钮用于停止某次测量过程,该按钮只在样快前处理不当或在火花台上位置放 置不当的情况下使用,按下该按钮后,屏幕上将不出现分析数据。 ?I形图案按钮用于开始某次测量,该功能也可通过键盘上的F2功能键实现 ?下边旋钮为维护旋钮,当对仪器进行维护时,须将旋钮旋至关闭状态(向左),在该状 态下,仪器将切断高压及火花激发源,只有在所有部件都归位的情况下,才可将维护旋钮打开。 火花台盒
火花台盒位于火花台的下方,通过把手可将火花台盒拉开。这时,可相应的把电极和火花台板松开。若要将其重新关上,只需用力往上推,直到听见清脆的锁紧声为止。 注意:在打开火花台盒之前,请将仪器背面的维修旋钮旋至关闭状态。 仪器背面视图 仪器背面面板包括了主电源开关,维修旋钮,氩气输入输出端等,虽然在日常工作中较少接触仪器背面面板,但为维修方便,请将仪器背面通道让出。 旋钮 在仪器背面面板上,有两个旋钮,分别是电源开关和维修旋钮。在进行仪器维护工作时,请将维修旋钮置于关闭状态,这样将断开高电压及火花激发源。只有在所有部件都归位的情况下,才可将维护旋钮打开。 只有在主电源开关和维护旋钮都开启的状态下,才可进行样快的分析工作。 电源插座 仪器背面的电源插座为计算机、显示器、打印机及其它设备提供电源输出,所借设备的功率不得高于300W。该电源接口不可用于真空净化器、打磨机、车床等高功率设备。 注意:即使仪器开关关闭,接口仍带有230V的电压。 仪器准备 检查氩气输出及压力 对于仪器的日常使用必须确保具有充足的氩气供应,氩气的输出压力应设定为3 bar 假如氩气通过氩气瓶供应的话,钢瓶压力应高于10bar,假如低于这个数值,请及时更换氩气瓶 废气瓶 废气瓶应装3/4左右的水
1 创远扫频仪相关介绍 本部分主要是这对ASPS所需数据通过上海创远Eagle扫频仪获取时,对应扫频仪如何正常设置、安装以及对应测试模式的设置,文件的导出。适用于Eagle扫频仪TDD-LTE单模与多模系列产品。 上海创远用于路测数据采集的软件称为“Eagle无线环境评估分析系统”。在本手册中,我们主要是借用“Eagle无线环境评估分析系统”前台数据采集部分,来说明Eagle扫频仪如何使用。本手册以下章节中如无特别说明,所述内容均适用于全系列Eagle扫频仪产品。 1.1 支撑型号 支持ASPS所需的TOPN测试机制的及相应文件输出的创远扫频仪的型号如下: 不同型号的扫频仪上报能力上存在较大差异。 1.2 测量所需设备 需要准备的设备与备附件: 1、笔记本电脑 2、Eagle 扫频仪 3、Eagle无线环境评估分析系统软件 4、扫频仪4G射频接收天线和GPS天线 5、数据线(网线) 6、扫频仪AC/DC电源适配器 1.3 测量前准备工作 1、将TDD-LTE射频天线连接到扫频仪前面板的RF2端口(RF1是为其他制式预留的)。 2、连接GPS天线到GPS端,将天线置于车顶。 3、接通设备电源,按扫频仪面板的power 开关。
4、LAN口处的指示灯红色闪烁表示扫频仪供电正常,连接网线端口数据线至电脑网 口,配置电脑IP地址(T2311A型号射频模块默认对应IP地址192.168.0.40;T2311A+ 型号射频模块默认对应IP地址192.168.1.40请注意,PC端本地连接IP地址设置勿与 扫频仪地址相同,否则会由于IP地址冲突无法连接设备。如有冲突,请及时更改本 地连接IP地址,建议设置为与默认地址不冲突的其他IP地址,如192.168.0.111; 192.168.1.111,子网掩码默认255.255.255.0 即可。) 5、指示灯变成绿色闪烁,扫频仪处于开工状态。 6、在测试电脑上完成Eagle无线环境评估分析系统软件安装。 1.4 软件的安装及配置 1.4.1 系统需求 为了使系统可靠运转,保证系统的性能要求,安装时务必保证系统具有以下配置。 硬件配置 CPU:奔腾4,1.7G及以上 内存:1G及以上 硬盘:30G及以上 软件配置 操作系统:Windows XP SP3;Windows 7.0 32位 办公软件:Microsoft Office 2000 /2003;Microsoft Office 2007 运行环境要求 在Eagle无线环境评估分析系统运行过程中,请关闭所有的杀毒软件、防火墙软件,避免这些软件对USB通信的干扰。 1.4.2 软件安装 软件安装环境检测 浏览光驱内的文件,打开文件夹找到Eagle.msi应用文件,双击该应用文件运行安装程序,开始软件的安装:
第7章扫频仪的使用 扫频仪是线性系统的频率特性测试仪器,属于频域测试类仪器。频率特性:指电信号的电参数随频率变化的规律。 频域测量的主要内容包括两项: 1)线性系统的频率特性测量,分为幅频特性测量和相频特性测量。其中幅频特性测量的主要仪器是频率特性测试仪即扫频仪。 2)信号的频谱分析:对信号本身的分析和线性系统非线性失真的测量等,主要仪器是频谱分析仪。 7.1BT-3D扫频仪的使用 扫频仪型号种类很多,但结构大体相同,下面以BT-3D为例加以介绍。 BT-3D频率特性测试仪为卧式通用大屏幕宽带扫频仪,它由扫频信号源和显示系统组合而成,广泛应用于1~300MHz范围内各种无线电网络,接收和发射设备的扫频动态测试.例如,各种有源无源四端网络、滤波器、鉴频器及放大器等的传输特性和反射特性的测量,特别适用于各类发射和差转台、MATV系统、有线电视广播以及电缆的系统测试.本仪器功能齐全,既可1~300MHz范围内全频段一次扫频,满足宽带测试需要,也可窄带扫频和给出稳定的单频信号输出.输出动态范围大,谐波值小,输出衰减器采用电控衰减,可在50mV一0.5V 范围内任取电压,适用于各种工作场合. 7.1.1 BT-3D扫频仪使用 1、面板结构,如图7.1-1。 1)示波显示部分: 电源开关:ON、OFF,打开与关闭电源。 辉度旋钮:调节显示的亮暗。 Y位移旋钮:调节荧光屏上光点或图形在垂直方向上的位置。
Y增益旋钮:调节显示在荧光屏上图形垂直方向幅度的大小。 Y衰减按键“×1 、×10”:输入信号衰减有1,10,两个衰减档级。根据输入电压的大小选择适当的衰减档级进行信号的输入。 影像极性开关:---(“+”、“-”极性):用来改变屏幕上所显示的曲线波形正负极性。当开关在“+”位置时,波形曲线向上方向变化(正极性波形);当开关在“一”位置时,波形曲线向下方向变化(负极性波形)。当曲线波形需要正负方向同时显示时,只能将开关在“+”和“一”位置往复变动,才能观察曲线波形的全貌。 Y输入耦合按键AC / DC :交流、直流输入耦合选择,检波后的信号以交流或直流方式耦合输入。 Y轴输入插座:由被测电路的输出端用电缆探头引接此插座,使输入信号经垂直放大器,便可显示出该信号的曲线波形。 同示波器相比,扫频仪显示控制要简单些,当然,不同型号仪器取舍不同,比如,大多数还会有辉度、聚焦、X增益等控制。本仪器在后面板上包含X增益调节。 图7.1-1 BT-3D扫频仪面板 2)扫频源及扫频控制
GHOST使用教程(图解)人人都可“拥有”4GHz的CPU **** 本内容跟帖回复才可浏览***** 河北的刘宗元朋友打电话告诉董师傅,他在查看朋友电脑的系统属性时,发现系统属性里显示这台电脑采用的是Intel的4GHz的P4 CPU(图1)。他很是好奇,要知道去年因4GHz P4 CPU难产,Intel的首席执行官贝瑞特曾当众下跪祈求原谅。 董师傅自然也不相信Intel真的出了4GHz的P4 CPU,不过对这个显示结果还是非常感兴趣,经过一番摸索,发现只要略施小计,我们每一个人都可以“拥有”4GHz的P4 CPU。你也想有这样一颗“心”?别着急,且听师傅慢慢道来。 都是sysdm.cpl文件“惹的祸” 知道了问题的关键,下面要做的就是修改信息了。 首先将C:WindowsSystem32文件夹下的sysdm.cpl文件复制一份出来,然后用资源编辑工具EXESCOPE打开复制出的sysdm.cpl文件,展开“资源→对话框→101”分支。在右侧一共有9个“Link Window”。除了第4、5个外,把另外七个的“可见”属性去掉(即去掉右侧“可见”前的钩),目的是在检测系统属性时只显示第4、5个的内容。 选中第4个“Link window”,在“标题”栏输入文字“Intel(R) Pentium4(R)处理器”;在第5个“Link window”的“标题”栏中输入“4 GHz,2048 MB 的内存”等信息(连内存信息也一并改了。数字可随意输入,但不可过长,否则显示效果较别扭);再将第4个“Link window”的“Y”坐标值改为“149”,将第5个的调整为“170”,以占据原来第1、2个“Link Window”的位置。 修改好后保存该文件,接下来只要用该文件替换原始文件即可。不过,在替换过程中,董师傅又遇到了一个新问题: 文件保护功能会“作祟” 董师傅使用的是Windows XP+SP2系统,要把修改后的sysdm.cpl文件复制到C:WindowsSystem32中替换原文件有些麻烦——SP2强大的文件保护功能会自动还原原始文件。 师傅我并不想禁用文件保护功能,所以借助文件替换工具Replacer解决了这个问题。 将下载回来的文件解压到任一文件夹,双击“replace.cmd”出现命令提示符窗口,将 C:WindowsSystem32sysdm.cpl文件拖到其中,回车;再将修改过的sysdm.cpl文件拖入其中并回车,输入“Y”后按回车,这样就能替换掉系统文件了(在弹出的Windows文件保护时请点“取消”)。 至此,董师傅所想要的4GHz的P4 CPU终于“出现”!心动了吧?那就赶快动手吧。 以上软件下面有得下载 资源编辑工具EXESCOPE 文件替换工具Replacer 一、什么是Ghost? Ghost(幽灵)软件是美国赛门铁克公司推出的一款出色的硬盘备份还原工具,可以实现FAT16、FAT32、NTFS、OS2等多种硬盘分区格式的分区及硬盘的备份还原。俗称克隆软件。 1、特点:既然称之为克隆软件,说明其Ghost的备份还原是以硬盘的扇区为单位进行的,也就是说可以将一个硬盘上的物理信息完整复制,而不仅仅是数据的简单复制;克隆人只能克隆躯体,但这个Ghost却能克隆系统中所有的东东,包
设备名称荧光光谱仪 设备型号HORIBA FL-3000/FM4-3000 设备操作规范: 一、开机前准备: 1、实验室温度应保持在15℃~30℃之间,空气湿度应低于75%。 2、确认样品室内无样品后,关上样品室盖。 二、开机 3、打开设备电源开关(氙灯自动点亮,预热20min; 4、打开计算机,双击桌面上的荧光光谱软件,进入工作站,等待光谱仪自检。 三、装样: 5、将样品处理为粉末状,装入样品槽,为防止样品脱落,可加盖载玻片;将样品槽装入样品室,盖好样品室盖子。 四、测试发射光谱: 6、点击菜单中的“Menu”按钮,选择“Spectral”项目中的“Emission”。 7、设置单色器(M:设置激发光波长(如460nm、发射波长扫描范围(如470nm-700nm和狭缝宽度(一般可设置1-5nm,荧光强度强,狭缝宽度要调小。 8、设置检测器(Detector:Formulars选择公式S1。 9、点击右下角“RUN”开始测量; 五、测试激发光谱:
10、点击菜单中的“Menu”按钮,选择“Spectral”项目中的“Excitation”。 11、设置单色器(M:设置监测波长(如625nm、发射波长扫描范围(如380nm-500nm和狭缝宽度(一般可设置1-5nm,荧光强度强,狭缝宽度要调小。 12、设置检测器(Detector:Formulars选择公式S1/R1。 13、点击右下角“RUN”开始测量。 六、测试量子产率: 14、线缆连接积分球:将积分球有指示箭头的一端连接激发口,另一端连接发射。 15、装样:将样品处理为粉末状,装入标准白板样品槽,并加盖石英片;将样品槽装入积分球样品台,先推上层样品台,卡好后,推入下层样品台。 16、点击软件菜单中的“Menu”按钮,选择“Spectral”项目中的“Emission”。 17、设置单色器(M:设置激发光波长(如460nm、扫描范围(如380nm-700nm和狭缝宽度(一般设置1nm。 18、设置检测器(Detector:选中暗电流选项和Correction S1选项,Formulars选择公式S1c,积分时间设置为1s(时间设置越大,扫描越慢。 19、点击右下角“RUN”开始扫描。 20、测试空白样品。测试方法如16-19,样品台内放置标准白板。 21、计算量子产率:点击“QY”按钮,在出现的对话框中设置如下参数:○1找校正谱(在D盘下“校正谱图”,选择固体校正谱;○2导入将要计算的样品谱图;○3导入空白样品谱图;○4输入需计算的激发与发射光谱起始与终止波长。 22、点击确定开始计算。
基站维护测试仪 第一章绪言 本章内容包括YBT250基站维护测试仪使用说明以及仪器开 始使用时的一般情况。 1.1 产品说明 本仪器为现场测试蜂窝小区基站最佳的射频测试仪。仪器 是一个基于NetTek测试仪平台模块化的测试仪。其标准结构实际上由两部分组成,仪器模块和NetTek分析仪平台。仪器模块由执行射频分析的硬件和软件构成。NetTek 分析仪平台是在仪器 模块中运行软件的“计算机”。YBT250可作为一个仪器的模块来购买,并加入到Net Tek分析仪平台中。 在NetTek分析仪平台你可附加三个仪器的模块,以扩展仪器 测试功能。仪器模块与平台之间的信息传输是通过内部总线相连。 NetTek分析仪平台是基于Windows CE操作系统。当购买了 PCMCIA以太网和调制解调器卡,可以组网和上网运行。 NetTek分析仪平台产品特点如下: ?带有触摸屏界面的彩色或黑白显示功能 ?模块化仪器结构 ?坚固的外壳 ?可拆装电池块 ?红外通信方式 ?输入/输出端口 ?软件应用以及能支持通信,功率管理,仪器配置,文本编辑,上网浏览等多种用途。 1.2 安装模块 其操作步骤如下: 1.选择Start>Suspend。关闭或悬挂NetTek分析仪平台的电源。 2.断开到分析仪平台的所有电缆连接。 3.利用四角减振器支持来平置分析仪平台。 4.从分析仪平台的背面移走总线门(见下图)。
5.注意下方连接到平台总线连接器的YBT250模块。(见下图) 6.按下,使与总线连接器能稳固安置牢以及确保良好接触。 7. 蝶形螺丝定位,见上图。 8.每个蝶形螺丝,反时针方向向下转动1/4圈,使其能露出。 9.顺时针方向转动螺丝,拧紧。确保均匀拧紧所有螺丝,但不要过 紧。 10.为使蝶形螺丝头隐埋,再使每个螺丝头在顺时针方向上旋转1/4 圈。
sniffer使用及图解 注:sniffer使用及图解sniffer pro 汉化注册版下载 黑白影院高清免费在线电影聚集网无聚集无生活,聚集网络经典资源下载 sniffer软件的安装还是比较简单的,我们只需要按照常规安装方法进行即可。需要说明的是: 在选择sniffer pro的安装目录时,默认是安装在c:\program files\nai\snifferNT目录中,我们可以通过旁边的Browse按钮修改路径,不过为了更好的使用还是建议各位用默认路径进行安装。 在注册用户时,随便输入注册信息即可,不过EMAIL一定要符合规范,需要带“@”。(如图1) 图1 点击放大 注册诸多数据后我们就来到设置网络连接状况了,一般对于企业用户只要不是通过“代理服务器”上网的都可以选择第一项——direct connection to the internet。(如图2) 图2 接下来才是真正的复制sniffer pro必需文件到本地硬盘,完成所有操作后出现setup complete提示,我们点finish按钮完成安装工作。 由于我们在使用sniffer pro时需要将网卡的监听模式切换为混杂,所以不重新启动计算机是无法实现切换功能的,因此在安装的最后,软件会提示重新启动计算机,我们按照提示操作即可。(如图3) 重新启动计算机后我们可以通过sniffer pro来监测网络中的数据包。我们通过“开始->所有程序->sniffer pro->sniffer”来启动该程序。 第一步:默认情况下sniffer pro会自动选择你的网卡进行监听,不过如果不能自动选择或者本地计算机有多个网卡的话,就需要我们手工指定网卡了。方法是通过软件的file菜单下的select settings来完成。 第二步:在settings窗口中我们选择准备监听的那块网卡,记得要把右下角的“LOG ON”前打上对勾才能生效,最后点“确定”按钮即可。(如图4) 图4 第三步:选择完毕后我们就进入了网卡监听模式,这种模式下将监视本机网卡流量和错误数据包的情况。首先我们能看到的是三个类似汽车仪表的图象,从左到右依次为“Utiliz ation%网络使用率”,“Packets/s 数据包传输率”,“Error/s错误数据情况”。其中红色区域是警戒区域,如果发现有指针到了红色区域我们就该引起一定的重视了,说明网络线路不好或者网络使用压力负荷太大。一般我们浏览网页的情况和我图11中显示的类似,使用率不高,传输情况也是9到30个数据包每秒,错误数基本没有。(如图5) 图5
AQ6370D光谱仪使用说明 1、目的 验证光接口性能是否满足相关标准要求 2、适用范围 AQ6370D光谱仪 3、职责 资产管理部和操作人员共同负责 4、组网图或测试环境配置 5、测试内容: 5.1 开机校准 1、打开电源,FC-FC接口的光纤将AQ6370D的光输入连接器与光输出连接器连接起来。 2、用内部参考光源执行对准调节 ①按SYSTEM OPTICAL ALIGNMENT ②按EXECUTE软键,自动执行对准调节。几分钟后,对准调节结束,仪器返回之前的画面。
3、用内置参考光源进行波长校准 ①按SYSTEM WL CALIBRATION 软键。 ②按BUILT-IN SOURCE 软键。 ③按EXECUTE 软键,执行波长校准。校准结束后,返回之前的画面。 5.2 测试条件设置 1、校准完成后,自动扫描,自动调整分辨率,得到波长和功率的大致范围。 ①按SWEEP AUTO 软键执行自动测量。 1 2 3
自动扫描结束后的显示 ②设置扫描范围,按SPAN键。 ③设置参考功率和刻度,按LEVEL键,参考功率设为-3dBm,其他为默认值。
④按SETUP键,设置分辨率为最高精度0.02nm。 ⑤设置灵敏度,模式为MID,其他条件均为默认值。
⑥设置完成开始测试,执行REPEA T重复扫描或者SINGLE单次扫5~10次后,按STOP键,分析并记录数据。 5.3 分析 光猫上电后,用脚本长发光后直接接到测试拓扑中。 1、DFB-LD、FP-LD光源分析 ①按ANAL YSIS,显示与测量波形分析相关的软键菜单 ②按ANAL YSIS 1软键,显示分析功能的选择菜单。 以GPON样机为例,光源类型选择DFB-LD,执行分析,结果显示在数据区域内。 分析: SMSR边模抑制比 PEAK WL峰值波长 20dB WIDTH带宽 CTR WL中心波长 注:功率以实际功率计测试为准
认知电脑 电脑的主要设备包括: 显示器 显示器开关,用来打开显示器,通常显示器打开状态下为开关指示灯(位于显示器开关旁边或显示器后方)亮着,显示器关闭状态开关指示灯则为熄灭。 电 脑 显示器 音箱 键盘 鼠标 主机 输出设备 输入设备 显示器开关
主机开关 主机重启开关 电脑主机如上图示主要有2个开关按钮,主机开关(通常为个头较大位于上方的开关按钮)用于作为电脑主机的开关,主机重启按钮(通常为个头较小位于较下方的开关按钮)用于作为电脑出现死机故障无法正常关机或重启的开关按钮,通常也叫短路开关。 键盘 键盘,电脑的重要输入设备之一,用于信息和操作录入的重要输入设备。
鼠标也作为电脑的重要输入设备,如上图所示,通常的鼠标主要有左键,滚动滑轮键, 右键这三个功能键组成。左右键的操作方式主要有:单击,双击,按住不放拖动鼠标等操作。 左键单击的作用:选中、连接、按钮的按入(像我们通常按电视遥控器按钮一样,打开了按钮显示的对应功能)。 左键双击的作用:打开windows 桌面的功能图标对应的功能。 注:通常2次敲击左键的间隔要尽可能小点,要快,否则电脑只认为你是做了2 次左键单击事件(只是对图标进行了2次选中操作),而不认为你是做1次左键双击事件,就不能达到你想要的打开这个功能的操作。如果出现上述的点击不够快的情况,只需重复回一次正确的双击操作就可以打开对应你所点击的图标功能。 右键单击的作用:打开你所点击的地方的高级菜单(高级功能菜单中有对你所点击的地方的大部分功能操作选项,通常有打开、改名即重命名、复制、删除、属性设置等功能)。右键单击弹出高级菜单后,将光标移进高级功能菜单里面,可以看见光标所在的菜单选项背景色改变为蓝色,这时你只要左键单击一下就可以进入这项功能。 注:如果失误右键点击弹出了高级菜单,只需将光标移到空白的地方(没文字,没图标,没按钮的地方)左键单击一次就可以退出并关闭高级菜单。 右键双击的作用:通常不使用右键双击,所以在不做详细介绍。 滚动滑轮的作用:通常文档或网页显示器不能一屏显示完,所以通常有部分在下方,这时我们想看下面的内容,就要将下面的内容拖上来看,这时就要使用滚动滑轮了。 滚轮向下滑动:页面向上拖动可以看到下面的内容。 滚轮向上滑动:页面向下拖动可以看到上面的内容。 左键 右键 滚动滑轮
. . AQ6370D光谱仪使用说明 1、目的 验证光接口性能是否满足相关标准要求 2、适用范围 AQ6370D光谱仪 3、职责 资产管理部和操作人员共同负责 4、组网图或测试环境配置 5、测试内容: 5.1 开机校准 1、打开电源,FC-FC接口的光纤将AQ6370D的光输入连接器与光输出连接器连接起来。 2、用内部参考光源执行对准调节 ①按SYSTEM OPTICAL ALIGNMENT ②按EXECUTE软键,自动执行对准调节。几分钟后,对准调节结束,仪器返回之前的画面。
3、用内置参考光源进行波长校准 ①按SYSTEM WL CALIBRATION 软键。 ②按BUILT-IN SOURCE 软键。 ③按EXECUTE 软键,执行波长校准。校准结束后,返回之前的画面。 5.2 测试条件设置 1、校准完成后,自动扫描,自动调整分辨率,得到波长和功率的大致范围。 ①按SWEEP AUTO 软键执行自动测量。 1 2 3
自动扫描结束后的显示 ②设置扫描范围,按SPAN键。 ③设置参考功率和刻度,按LEVEL键,参考功率设为-3dBm,其他为默认值。
④按SETUP键,设置分辨率为最高精度0.02nm。 ⑤设置灵敏度,模式为MID,其他条件均为默认值。
⑥设置完成开始测试,执行REPEAT重复扫描或者SINGLE单次扫5~10次后,按STOP键,分析并记录数据。 5.3 分析 光猫上电后,用脚本长发光后直接接到测试拓扑中。 1、DFB-LD、FP-LD光源分析 ①按ANALYSIS,显示与测量波形分析相关的软键菜单 ②按ANALYSIS 1软键,显示分析功能的选择菜单。 以GPON样机为例,光源类型选择DFB-LD,执行分析,结果显示在数据区域内。 分析: SMSR边模抑制比 PEAK WL峰值波长 20dB WIDTH带宽 CTR WL中心波长 注:功率以实际功率计测试为准
日本目黑MSW—7125A扫频仪 使用指南 (一):仪器能够提供的具体指标为: 1.包括 IF(455KHz/10.7MHz),LW,MW,SW,FM波段 2.具有窄频与宽频扫频功能 3.扫频范围 455KHz/10.7MHz/0.1-3MHz/1.5-30MHz/63-110MHz 4.扫频宽度 10KHz-36MHz 5.输出电平(50欧负载) 100dBu(0.1rms)准确度±1dB 输出控制 80dB(1dB/每步进) 6.频率可变范围扫描范围内任意的5个频率点 7.设定方式(存储方式) 4位或5位最小设定位数 0.1KHz/1KHz/10KHz 8.显像管 23cm(9英寸)电磁偏转,垂直灵敏度 1mV/格,可变,附有20dB衰减器 9.频率响应 DC-10KHz 10.外形尺寸/重量约230W*330H*370Dmm/10.5kg (二)面板上各键及各位置功能 1、显示屏显示测试波形,这个部位无需操作 2、显示屏下部的左边一排灯:每个灯的上面都有一个波段代号 “455KHz”,“10.7MHz”,“LW-MW”,“SW”,“FM”,这排灯的左边标注着“band”意即波段的意思。在工作状态,这排灯肯定会有一个会点亮,表示当前工作在某一个波段。
BAND (波段)455KHZ 10.7MHZ LW-MW SW FM CHANNEL(通道号)1、2 、3、4、5 左边一排灯的下面有一排按键,共六个。每一个按键上方都有一个数字,从左往右依次为1,2,3,4,5,6,键左边标识有“CHANNEL”的字样,表示通道号。每个按键的中间都有一个小灯,当您按下某一个键时它中间的那颗灯就会点亮,告知您已经工作于此通道状态了。 3、通道的按键下面有两个稍微大些的黑色旋钮 左边的旋钮上边标识有“Y-GAIN”,工作时拧动它可以调节显示屏上显示曲线的幅度值,免得这根曲线太大跑到显示屏的外边或太小我们看不清楚,当这个钮拧到最大位置(顺时针旋到底)的时候,如果没有衰减的话垂直的幅度就是显示屏上1个厘米的长度代表1个毫伏特的电压。 如果这个旋钮不在最大位置而是中间某个位置?我们就要计算。在“Y-GAIN”钮的右下方有两个小小的可以拨来拨去的钮?正常工作的时候,一般都是拨在“OFF”的位置上,如果拨到另一边“0.1”的位置时,此时显示屏上当出现两条竖线,这个竖线的在显示屏上的长度值如果没有受到衰减的话,代表了0.1Vpp的信号在显示屏的长度,当您拧动上面“Y-GAIN”的钮时这个竖线的长度也会跟着变化,但不管它有多长,始终是代表了0.1Vpp的信号应该具有的长度,记住这个0.1Vpp信号的长度后,再把这个小开关拨回“OFF”的位置,拨回去后一定不要再去拧“Y-GAIN”这个钮了,此时再看显示屏上
GHOST使用教程(图解) 收集者:小路发布于:https://www.doczj.com/doc/b46816427.html, 发布时间:2007- 5-6 12:50:48 发布人:小路 减小字体增大字体 一、什么是Ghost? Ghost(幽灵)软件是美国赛门铁克公司推出的一款出色的硬盘备份还原工具,可以实现FAT16、FAT32、NTFS、O S2等多种硬盘分区格式的分区及硬盘的备份还原。俗称克隆软件。 1、特点:既然称之为克隆软件,说明其Ghost的备份还原是以硬盘的扇区为单位进行的,也就是说可以将一个硬盘上的物理信息完整复制,而不仅仅是数据的简单复制;克隆人只能克隆躯体,但这个Ghost却能克隆系统中所有的东东,包括声音动画图像,连磁盘碎片都可以帮你复制,比克隆人还厉害哟:)。Ghost支持将分区或硬盘直接备份到一个扩展名为.gho的文件里(赛门铁克把这种文件称为镜像文件),也支持直接备份到另一个分区或硬盘里。 2、运行ghost:至今为止,ghost只支持Dos的运行环境,这不能说不是一种遗憾:(。我们通常把ghost文件复制到启动软盘(U盘)里,也可将其刻录进启动光盘,用启动盘进入Dos环境后,在提示符下输入ghost,回车即可
运行ghost,首先出现的是关于界面,如图 按任意键进入ghost操作界面,出现ghost菜单,主菜单共有4项,从下至上分别为Quit(退出)、Options(选项)、Peer to Peer(点对对,主要用于网络中)、Loca l(本地)。一般情况下我们只用到Local菜单项,其下有三个子项:Disk(硬盘备份与还原)、Partition(磁盘分区备份与还原)、Check(硬盘检测),前两项功能是我们用得最多的,下面的操作讲解就是围绕这两项展开的。 3、由于Ghost在备份还原是按扇区来进行复制,所以在操作时一定要小心,不要把目标盘(分区)弄错了,要不
ARL 3460型直读光谱仪操作说明书一.使用前注意事项 1.室内温度控制在22-27摄氏度,门窗一般不开,环境保持稳定且恒 温,保持室内处于无尘环境; 2.室内湿度控制在20%-80%以内,湿度太大时会影响试验结果; 3.总电源开关有断电保护功能,应对自动跳闸,有保护仪器的功能; 4.开机之前,先检查光谱仪各个开关是处于“开”或“关”什么状 态。如果是开,先依次关机,然后打开总电源开关,再开机; 5.打开稳压器黑色开关后,首先检查输出电压是否为220±5V,其次 检查指针是否稳定; 6.开机必须严格按规定顺序开机,每个开关等待间隔15s左右启动下 一个开关,关机按照开机的反顺序依次关机; 7.电脑的开关机只受稳压器电源开关控制,与仪器5个开关无关; 8.仪器完全冷却,需要一个稳定的过程,所以须在使用前8h开机, 经常使用仪器,则仪器和空调24h开机; 9.更换氩气瓶时,先用无水乙醇将氩气瓶出口擦拭干净,再打开点氩 气将酒精挥发掉后,更换氩气; 10.氩气瓶压强不得低于2Mpa,接近2Mpa时则须更换氩气,不使用 仪器时,将气压表调到0.1Mpa或净化机打到暂停,节约氩气; 11.更换氩气时,不能让空气进到净化机内; 12.打开氩气总开关,将氩气气压调到0.25Mpa-0.3Mpa; 13.制备后的样品,不能沾到水或油,以免影响测试结果,且严重时 会引起火灾; 14.开机后,点击F7查看仪器状态,有没有报警信息;
15.样品需现用现制,以防影响测试结果; 16.当仪器正面黄色罗盘不小心被转动,必须做完标准化,再进行定 量分析; 17.当标准试样用到一半时,应及时向我公司反映并请求订购。二.样品的制备 1.样品制备要求 样品最小体积必须盖住激发台圆口,不能漏出氩气;最大体积必须能在激发台内放的开。样品形状没有要求,不过一般为圆柱形居 多。 试样尺寸要求: 直径D:?20mm≤D≤?60mm;高度H:30mm≤H≤70mm。 2.样品制备过程 取圆柱形铝棒样块,在锯床上锯成正方体,然后用无水乙醇清洗锯割好的样品、车床上的三爪卡盘、刀片等,去除油和杂质, 防止干扰试验结果。在车床上将方形样品车成圆柱状,最后车端面,手不能触碰车好的样品端面,将车好的样品保存到干燥器皿中,以 备试验时使用。 三.光谱仪的组成,用途及分析原理 1.光谱仪组成 氩气净化机一台,稳压器一台,光谱仪一台,电脑一台,主机一 台,打印机一台。