
Annual I-O_MakeUse_ReadMe
This file contains make and use tables data, after redefinitions, from the annual input-output (I-O) accounts for 1998-2007. New make and use table data for 2007 and revised statistics for 2006 and 2005 were released on December 15, 2008. The statistics for 2004 are consistent with the 2007 annual revision to the annual industry accounts, released on January 29, 2008. The statistics for 2003 are consistent with the 2006 annual revision to the annual industry accounts, released on December 11, 2006. The statistics for 2002 are consistent with the 2005 annual revision to the annual industry accounts, released on December 15, 2005. Statistics for 1998-2001 were released on June 17, 2004, as part of the comprehensive revision of the annual industry accounts. Statistics for all years were prepared with methodologies that are unique to the integrated annual industry accounts, and are for industries defined according to the 1997 North American Industrial Classification System (NAICS). Detailed definitions of NAICS industries are available at:
NAICS Definitions
The input-output (I-O) accounts show how industries interact; specifically, they show how industries provide input to, and use output from, each other to produce Gross Domestic Product (GDP). These accounts provide detailed information on the flows of the goods and services that comprise the production process of industries. The I-O accounts are presented in a set of tables: Use, Make, Direct Requirements and Total Requirements. The Use table shows the inputs to industry production and the commodities that are consumed by final users. The Make table shows the commodities that are produced by each industry. The four Requirements tables are derived from the Use and Make tables. The Direct Requirements table shows the amount of a commodity that is required by an industry to produce a dollar of that industry's output. The three Total Requirements tables show the production that is required, directly and indirectly, from each industry and each commodity to deliver a dollar of a commodity to final users. The Use table is the most frequently requested table because of its applications to the estimates of GDP. For more information on the definitions and conventions used in the U.S. input-output accounts, please refer to the "Concepts and Methods of U.S. Input-Output Accounts" published in September 2006 at
https://www.doczj.com/doc/df8621661.html,/papers/pdf/IOmanual_092906.pdf
The 1998-2007 annual input-output accounts are part of the integrated annual industry accounts that provide consistent measures of industry output, intermediate inputs, and value added within a balanced input-output framework. For more information on the integrated annual industry accounts see the March 2004 Survey of Current Business, "Preview of the Comprehensive Revision of the Annual Industry Accounts" at
https://www.doczj.com/doc/df8621661.html,/bea/ARTICLES/2004/03March/0304IndustryAcctsV3.pdf
The 1998-2007 annual input-output accounts do not reflect the 2002 benchmark I-O accounts released in September 2007. The 2002 benchmark I-O accounts will be incorporated into the annual I-O accounts as part of the annual industry accounts comprehensive revision in late 2009 or early 2010. For an overview of the benchmark input-output accounts, please refer to "U.S. Benchmark Input-Output Accounts, 2002" in the September 2007 issue of the Survey of Current Business, at
https://www.doczj.com/doc/df8621661.html,/scb/pdf/2007/10%20October/1007_benchmark_io.pdf
The spreadsheet page for a given year includes both the "make" and "use" matrices for that year. Values represent millions of dollars at producers' prices. No copyrighted data are found in these files.
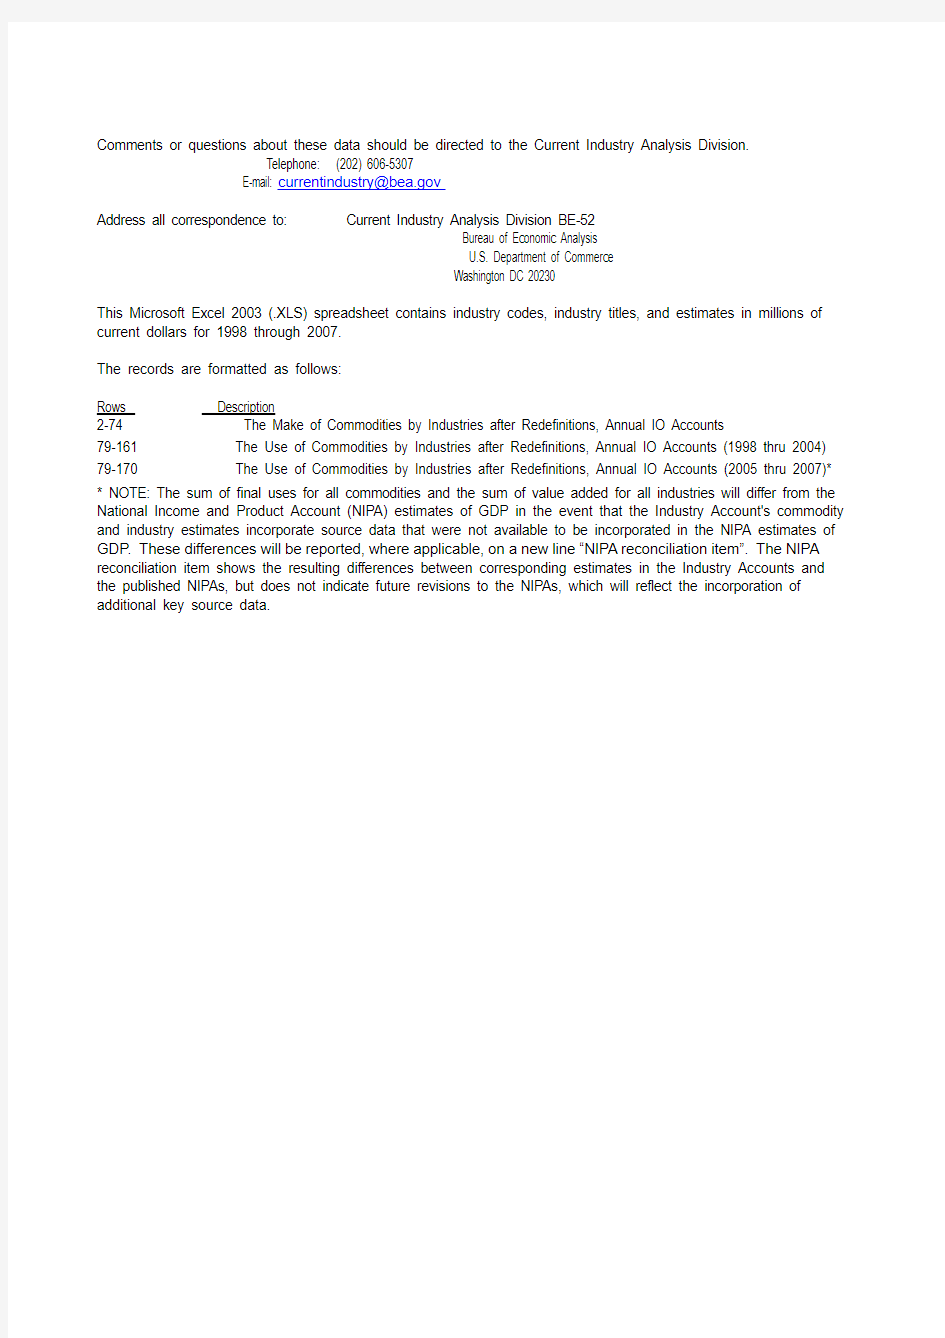
Comments or questions about these data should be directed to the Current Industry Analysis Division.
Telephone: (202) 606-5307
E-mail: currentindustry@https://www.doczj.com/doc/df8621661.html,
Address all correspondence to: Current Industry Analysis Division BE-52
Bureau of Economic Analysis
U.S. Department of Commerce
Washington DC 20230
This Microsoft Excel 2003 (.XLS) spreadsheet contains industry codes, industry titles, and estimates in millions of current dollars for 1998 through 2007.
The records are formatted as follows:
Rows Description
2-74 The Make of Commodities by Industries after Redefinitions, Annual IO Accounts
79-161 The Use of Commodities by Industries after Redefinitions, Annual IO Accounts (1998 thru 2004) 79-170 The Use of Commodities by Industries after Redefinitions, Annual IO Accounts (2005 thru 2007)* * NOTE: The sum of final uses for all commodities and the sum of value added for all industries will differ from the National Income and Product Account (NIPA) estimates of GDP in the event that the Industry Account's commodity and industry estimates incorporate source data that were not available to be incorporated in the NIPA estimates of GDP. These differences will be reported, where applicable, on a new line “NIPA reconciliation item”. The NIPA reconciliation item shows the resulting differences between corresponding estimates in the Industry Accounts and the published NIPAs, but does not indicate future revisions to the NIPAs, which will reflect the incorporation of additional key source data.