Line chart/line graph
The line graph illustrates the date about people at a London subway station from 6 am to 10 pm.
As we can see from the line graph, the number of people using this station fluctuates over these 16 hours.
More specifically, at first at 6 am the number of people at the station stands at only 100.
Then, the number shoots up over the next two hours, peaking at 400 at 8 am.
After that, the number declines rapidly for two hours, bottoming out at 180 at 10 am.
The period between 10 o 'clock and 12 o'clock experiences a slight growth in the number of people in the station, with the number reaching 280 at midday.
Numbers in the following two hours level off at just under 300 people.
From this point onwards, the number plunges to only 100 from 2 pm to 4 pm.
The next two hours experiences a sharp rise again, with 6 pm arriving at 380 people.
After 6 pm, the number falls again, reaching the lowest point of 130 at 8 pm.
The period from 8 pm to 10 pm sees a slight rise, but finally the number of people declines again from 180 at 9 pm to 135 at 10 pm.
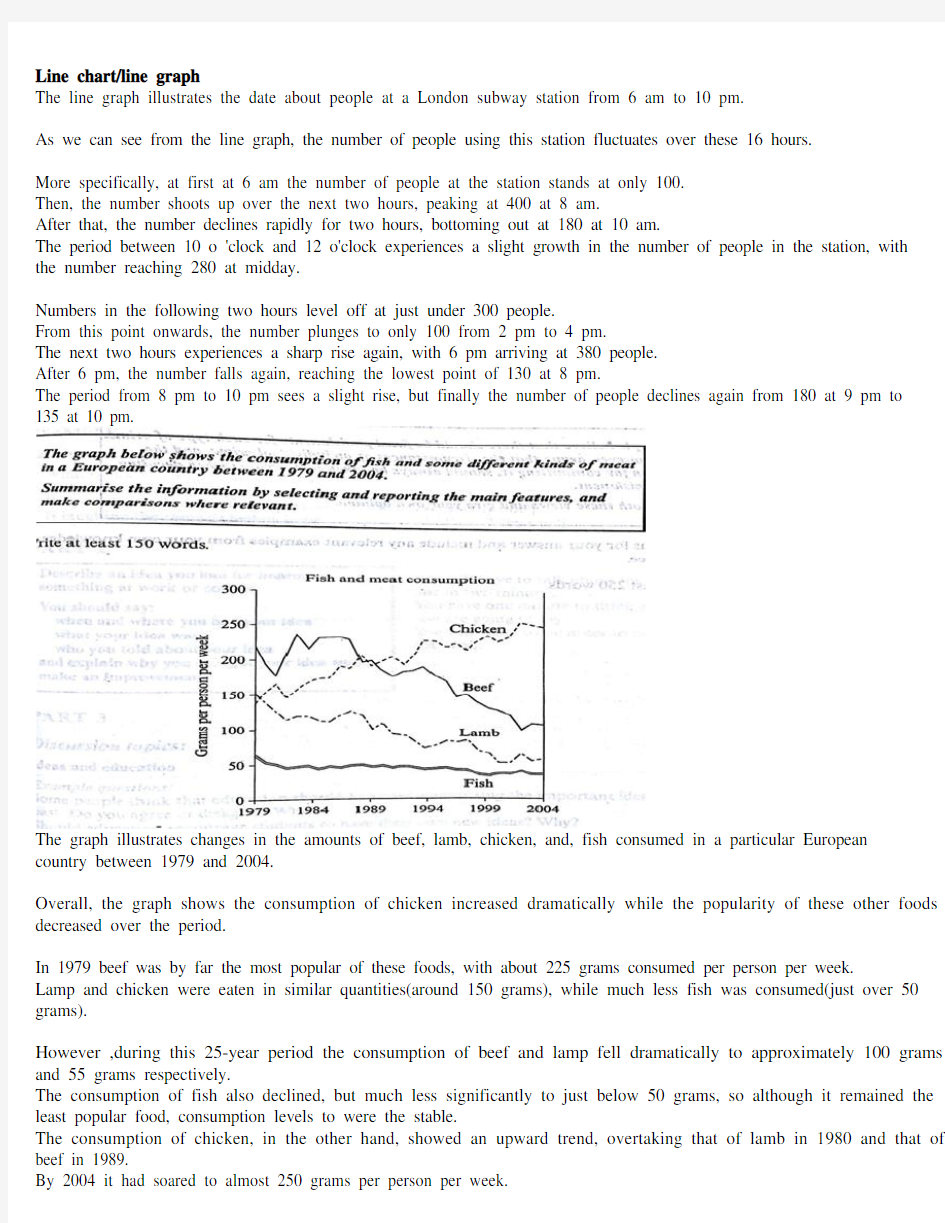
The graph illustrates changes in the amounts of beef, lamb, chicken, and, fish consumed in a particular European country between 1979 and 2004.
Overall, the graph shows the consumption of chicken increased dramatically while the popularity of these other foods decreased over the period.
In 1979 beef was by far the most popular of these foods, with about 225 grams consumed per person per week.
Lamp and chicken were eaten in similar quantities(around 150 grams), while much less fish was consumed(just over 50 grams).
However ,during this 25-year period the consumption of beef and lamp fell dramatically to approximately 100 grams and 55 grams respectively.
The consumption of fish also declined, but much less significantly to just below 50 grams, so although it remained the least popular food, consumption levels to were the stable.
The consumption of chicken, in the other hand, showed an upward trend, overtaking that of lamb in 1980 and that of beef in 1989.
By 2004 it had soared to almost 250 grams per person per week.
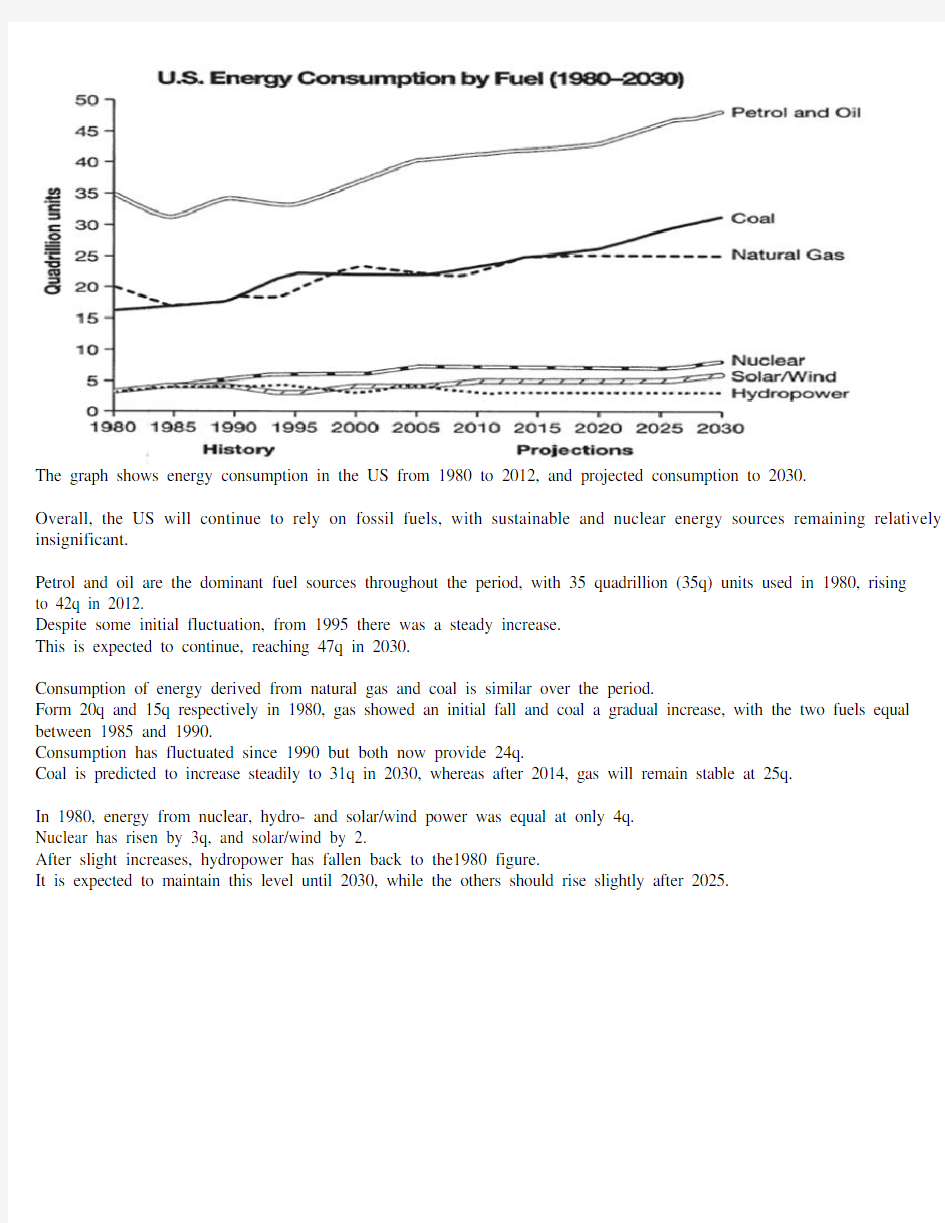
The graph shows energy consumption in the US from 1980 to 2012, and projected consumption to 2030.
Overall, the US will continue to rely on fossil fuels, with sustainable and nuclear energy sources remaining relatively insignificant.
Petrol and oil are the dominant fuel sources throughout the period, with 35 quadrillion (35q) units used in 1980, rising to 42q in 2012.
Despite some initial fluctuation, from 1995 there was a steady increase.
This is expected to continue, reaching 47q in 2030.
Consumption of energy derived from natural gas and coal is similar over the period.
Form 20q and 15q respectively in 1980, gas showed an initial fall and coal a gradual increase, with the two fuels equal between 1985 and 1990.
Consumption has fluctuated since 1990 but both now provide 24q.
Coal is predicted to increase steadily to 31q in 2030, whereas after 2014, gas will remain stable at 25q.
In 1980, energy from nuclear, hydro- and solar/wind power was equal at only 4q.
Nuclear has risen by 3q, and solar/wind by 2.
After slight increases, hydropower has fallen back to the1980 figure.
It is expected to maintain this level until 2030, while the others should rise slightly after 2025.
BAR CHART
The bar charts illustrate how developing and developed countries participated in education and science in the years of 1980 and 1990.
In terms of years of schooling, both developing countries and industrialized countries experienced stable increase, with the former increasing from 2.5 years of schooling in 1980 to 3.5 years in 1990, and the latter growing from 8.5 years in 1980 to 10.5 years in 1990.
When it comes to scientists and technicians per 1000 people, developing countries, as well as industrialized countries, show a similarly upward trend.
There were about 10 scientists and technicians per 1000 people for developing countries in 1980 while there were approximately 42 people for industrialized countries in the same period.
The gap widened in 1990, with 15 scientists and technicians per 1000 people in less developed countries but 70 in developed countries.
Unlike the 2 indicators above-mentioned, spending on research and development has seen a utterly different picture in developing countries.
While developed countries have more than doubled their spending on Research & Development from $150 billion to $350 billion, developing countries diminished theirs from $50 billion to $25 billion.
The chart shows the time spent by UK residents on different types of telephone calls between 1995 and 2002.
To sum up, although local fixed line calls were still the most popular in 2002, the gap between the three categories had narrowed considerably over the second half of the period in question.
Local fixed line calls were the highest throughout the period, rising from 72 billion minutes in 1995 to just under 90 billion in 1998.
After peaking at 90 billion the following year, these calls had fallen back to the 1995 figure by 2002.
National and international fixed line calls grew steadily from 38 billion to 61 billion at the end of the period in question, though the growth slowed over the last two years.
There was a dramatic increase in mobile calls from 2 billion to 46 billion minutes.
This rise was particularly noticeable between 1999 and 2002, during which time the use of mobile phones tripled.
PIE CHART
It can be concluded from the pie chart that chicken is the most commonly bought meat while others is the least commonly bought meat.
As can be seen in the pie chart, chicken, which makes up 40%, is the most popular among the total meat sold, then next is pork with 20%, followed by beef, constituting 18%, and finally come lamb, fish and others at 15%, 5% and 2% respectively.
It should be noted that the sale of pork is half as much as that of chicken.
And it is also interesting to note that the sale of chicken is 20 times as much as that of others.
The charts show how much a UK school spent on different running costs in three separate years:1981,1991 and 2001.
Overall, teachers’ salaries constitutes the largest cost to the school, and while spending increased dramatically for equipment and insurance, there were corresponding drops on expenditure on things such as books and on other workers’ salaries.
In all three years, the greatest expenditure was on staff salaries.
But while other workers’ salaries saw a fall from 28% in 1981 to only 15% of spending in 2001, teachers’ pay remained the biggest cost, reaching 50% of total spending in 1991 and ending at 45% in 2001.
Expenditure on resources such as books had increased to 20% by 1991 before decreasing to only 9% by the end of the period.
In contrast, the cost of furniture and equipment saw an opposite trend.
This cost decreased to only 5% of total expenditure in 1991 but rose dramatically in 2001 when it represented 23% of the school budget. Similarly, the cost of insurance saw a rising trend, growing from only 2% to 8% by 2001.
The charts compare the source of electricity in Australia and France in the years 1980 and 2000.
Overall, it is clear that by 2000 these two countries relied on different principal fuel sources: Australia relied on coal and France on nuclear power.
Between these years electricity production almost doubled, rising from 100 units to 170 in Australia, and from 90 to 180 units in France.
In 1980 Australia used coal as the main electricity source(50 units) and the remainder was produced from natural gas, hydro power(each producing 20 units) and oil(which produced only 10 units). By 2000, coal had become the fuel for more than 75% of electricity produced and only hydro continued to be another significant source supplying approximately 20%.
In contrast, France used coal as a source for only 25 units of electricity in 1980, which was matched by natural gas. The remaining 40 units were produced largely from oil and nuclear power, with hydro contributing only 5 units.
But by 2000 nuclear power, which was not used at all in Australia, had developed into the main source, producing almost 75% of electricity, at 126 units, while coal and together produced only 50 units.
Other source were no longer significant.
The table shows percentages of consumer expenditure for three categories of products and services in five countries in 2002.
It is clear that the largest proportion of consumer spending in each country went on food, drinks and tobacco.
On the other hand, the leisure/education category has the lowest percentages in the table.
Out of the five countries, consumer spending on food, drinks and tobacco was noticeably higher in Turkey, at 32.14%, and Ireland, at nearly 29%.
The proportion of spending on leisure and education was also highest in Turkey, at 4.35%, while expenditure on clothing and footwear was significantly higher in Italy, at 9%, than in any of the other countries.
It can be seen that Sweden had the lowest percentages of national consumer expenditure for food/drinks/tobacco and for clothing/footwear, at nearly 16% and just over 5% respectively.
Spain had slightly higher figures for these categories, but the lowest figure for leisure/education, at only 1.98%.
The figure illustrates the process used by the Australian Bureau of Meteorology to forecast the weather.
There are four stages in the process, beginning with the collection of information about the weather.
This information is then analyzed, prepared for presentation, and finally broadcast to the public.
Looking at the first and second stages of the process, there are three ways of collecting weather data and three ways of analyzing it.
Firstly, incoming information can be received by satellite and presented for analysis as a satellite photo.
The same data can also be passed to a radar station and presented on a radar.
Finally, drifting buoys also receive data which can be shown on a synoptic chart.
At the third stage of the process, the weather broadcast is prepared on computers.
Finally, it is delivered to the public on television, on the radio, or as a recorded telephone announcement.
The picture illustrates the way in which water passes from ocean to air to land during the natural process known as the water cycle.
Three main stages are shown on the diagram.
Ocean water evaporates, falls as rain, and eventually runs back into the oceans again.
Beginning at the evaporation stage, we can see that 80% of water vapors in the air comes from the oceans.
Heat from the sun causes water to evaporate, and water vapour condenses to form clouds.
At the second stage, labeled ‘precipitation’ on the diagram, water falls as rain or snow.
At the third stage in the cycle, rainwater may take various paths.
Some of it may fall into lakes or return to the oceans via ‘surface runoff’.
Otherwise, rainwater may filter through the ground, reaching the impervious layer of the earth.
Salt water intrusion is shown to take place just before groundwater passes into the oceans to complete the cycle.
The map shows the growth of a village called Chorleywood between 1868 and 1994.
It is clear that the village grew as the transport infrastructure was improved.
Four periods of development are shown on the map, and each of the populated areas is near to the main roads, the railway or the motorway.
From 1868 to 1883, Chorleywood covered a small area next to one of the main roads.
Chorleywood Park and Golf Course is now located next to this original village area.
The village grew along the main road to the south between 1883 and 1922, and in 1909 a railway line was built crossing this area from west to east.
Chorleywood station is in this part of the village.
The expansion of Chorleywood continued to the east and west alongside the railway line until 1970.
At that time, a motorway was built to the east of the village, and from 1970 to 1994, further development of the village took place around motorway intersections with the railway and one of the main roads.
●批改By Will 本次批改严格按照ILETS小作文评分标准进行。ILETS小作文评分项:TA (内容的完整性), CC (连贯性及一致性), GRA (语法范围及精准度), LR (词汇资源)。文末会进行总评及打分。 ●文中标识: 用词不当逻辑错误语法错误修改添加 The graph provides the information concerning the average temperatures on a month basis in three major cities.(介于有两张图,都要提一下。此后可加一句:In addition, clearly demonstrated in the table are the time of sunshine on an annual base.) (补充:在下一段看到了你对于后一张图的总结,这样的话建议你在开头强调一下“the first graph”) As can be seen from the graph, there is a similar trend in terms of average monthly temperature between London and New York during the period from January to December. (可加入连接词:To be specific) The average temperature in London (介于你后面写的是两个城市的数据,这里改为:for both of the cities) gradually rises from January to July both in London and new york, reaching a peak at 25 degrees and 20 degrees respectively. After that, the following 4 months witness a dramatic decrease both in London and new york. In comparison (这里不妨分段), an opposite trend is found in Sydney. It (这是悉尼的第一句,建议写出来具体的量词至少:The temperature) keeps stable at 25 degrees from January to march, after which the average temperature undergoes a considerable descent, reaching the bottom point at approximately 15 degrees, before there is (there is 没必要了,可以去除) a steady ascent by 10 degrees. It is obvious that the table depicts the average number of hours of sunshine per year in three major cities. As we can see from the statistics, when it comes to the total annual hours of sunshine, new york ranks first, followed by Sydney ,London lies last. Specifically, people who live in new york enjoy 2,353 hours of sunshine every year, which is similar to people living in London with 2,473 hours (不是人和人像,是时间长短像,改为:which is similar to the amount of sunshine for those in London). However, only 1,180 hours of sunshine are found in London annually. 总评6.5(TA6.5 CC6.5 LR6.5 GRA7.0) 1.语法变化上从句数量可以了,分词的使用还可以多一些。偶尔试试一到两句倒装,如我在开头给你的那个。 2.趋势等词汇变化可以,试着多换换题目话题词汇,如people=residents=citizens
作文范文之雅思小作文真题
雅思小作文真题 【篇一:雅思作文题目汇总】 一、教育 1、教育应该包括哪些内容? 母题:it is generally believed that education is of vital importance to the development of individuals and the well-being of societies. what should education consist of to fulfil both these functions? (050312) 提示:本题围绕教育的两大功能来展开(个人与社会),准备好这篇文章,即可应付教育类话题中的最大分支—教育的功能,做到以不变应万变。对于社会角度,可以从促进经济发展、增加社会流动性(social mobility)、维护社会稳定这几个方面来展开,对于个人,可以写改变思维模式、有利于就业和便利生活来写。 子题:大学应当教授理论知识还是实践技能?大学的是应当把学生培养成合格的公民还是让他们自己得益?准备未来职业最好的方法是上大学还是尽快离校积累工作经验?大学要不要扩招?中学阶段应当提供通才教育还是专才教育?要不要延长义务教育年限?要不要让农村地区的学生更容易上学?老师要教学生如何判断是非吗? 2、学校的科目谁来选择?(060916) 母题:some people think that the government should decide which subjects students should study at the university, while others think that students should be allowed to apply for the subject they prefer. discuss the two views and give your opinion. 提示:这类题目采取的策略就是“双批判”,因为题目中提供的两种选择往往都是错误的。
雅思经典小作文柱状图4篇范文+写作要点分析 C1T3 题目 The chart below shows the amount of money per week spent on fast foods in Britain. The graph shows the trends in consumption of fast foods. Write a report a university lecturer describing the information shown below. The chart shows that high income earners consumed considerably more fast foods than the other income groups, spending more than twice as much on hamburgers (43 pence per person per week) than on fish and chips or pizza (both under 20 pence). Average income earners also favored hamburgers, spending 33 pence per person per week, followed by fish and chips at 24 pence, then pizza at 11 pence. Low income earners appear to spend less than other income groups on fast foods, though fish and chip remains their most popular fast food, followed by
1.所以,正像我所理解的,尽管计算机在教育领域被广泛应用,但教师仍在课 堂上起着重要的作用。Therefore, as I see it, although computers are widely used in education, teachers still play important role in the classroom. 2.从上面所讨论的,我们会得出最后结论:公司应当鼓励55岁以上的人退休, 从而给年轻一代更多的机会。 From what has been discussed above, we may finally draw the conclusion that company should encourage people above 55 years old to retire in order to give opportunities to a new generation. 3.就像俗话所说,“有多少人,就有多少种观点”。来自不同背景的人对同样的 问题有不同的看法是可以理解的。 As the proverb goes, “So many people, so many minds.” It is quite understandable that people from different background have different interpretations of the same issue. 4.随着社会的发展,越来越多的问题引起我们的注意,其中一个问题是:人们 过多的使用电脑使人们的社会能力已经下降。 Along with the development of society, more and more problems are brought to our attention, one of which is that people use computers so often that their social skills have been diminished. 5.首先,科学家和艺术专家,如商人、语言学家、作家、历史学家和哲学家, 为社会做出了同等的贡献。 First and foremost, both scientists and art specialists, such as businessmen, linguists, writers, historians and philosophers, contribute equally to society. 6.第二,对现代技术的过度使用使娱乐活动变得筋疲力尽而不是轻松。 Secondly, the overuse of modern technology in recreational activities makes such activities exhausting rather than relaxing. 7.显而易见,我们可以的下出这样的结论,中学生应该在17岁以前学习普通课 程而不是特殊课程。 It is obvious for us to conclude that high school students should study general subjects instead of special subjects before they are 17 years old. 8.所以,如果我们认真的考虑一下,不难得出结论:大学应该在每个学科种招 收同等数量的男生和女生。 So, if we take careful consideration, it is not difficult to get the conclusion that universities should accept equal numbers of male and female students for studying in every subject 9.基于上述讨论和分析,我们可以看到商科专业的人才可以为国家的发展做出 巨大贡献,因此也应得到政府的支持。 Based on the above discussion and analysis, we can see that the talented students who have majored in business can make great contributions to the development of the country, so they should get support from the government too. 10.此现象最坏的方面,在我看来,是巨大的工作压力对人们精神健康的逐渐影 响。 The worst aspect of this phenomenon, in my opinion, is that the huge pressure of work will gradually affect people’s mental health. 11.它是如此的重要,以至于我们不能出一点差错。然而,作出一个谨慎而又令
101. You should spend about 20 minutes on this task. The line graph below gives information about the number of visitors to three London museums between June and September 2013. Summarise the information by selecting and reporting the main features, and make comparisons where relevant. Write at least 150 words. Test Tip Check the horizontal axis to find whether the graph refers to past, present, future or all three. We use the present simple to describe the graph: The graph shows… , We can see… If the graph refers to past period of time, we use the past simple, and if the graph includes future times, we use will or it is predicted that. Look at the line graph and complete the text with the correct forms of the verbs in brackets and the correct prepositions.
雅思写作小作文范文118篇之范文14 以下是三立在线雅思网给大家分享的雅思写作小作文范文118篇:范文14。希望对大家的雅思备考有所帮助,更多雅思备考资料欢迎大家随时关注三立在线雅思网。 范文14 The computer is widely used in education,and some people think teachers do not play important roles in the classroom. To what extend do you agree or disagree? In this period of communication,computer has been used in all kinds of fields widely, and plays a particular role in our lives. Especially computer has become more and more important in educational field, therefore dozens of people considered teachers could be replaced computers that will go with the current of the times. The above point is certainly wrong; this essay will outline three reasons. The main reason is that people’s brain better than computer. Firstly, people design all kinds of computer’s programs. Secondly, computer doesn’t have logistic ideation. Computer only can defend on that designer inputted computer’s programs to judge a question’s right or wrong. In other words, computer can’t defend on thinking that computer independently analyzes a question’s right or wrong. In case, designer inputted programs that are wrong. Computer output the result that also will be wrong. If this kind of problem happened in classroom, students would be infused plenty of wrong information.
Going global It’s almost impossible for people nowadays to image what our life would be if we are not in a process that is called globalization. The great economists have already figured out the benefits brought by international trade which is part of going global, and we have to admit this even from real life experience if you know the coffee in your cap is from Vietnam. Thanks to global community, you can get the Australian oatmeal and black tea of Sri Lanka just from the supermarket’s shelves of your neighborhood. And don’t forget why Julian Assange, an ordinary individual, enraged Washington? Obviously it’s because thousands of people just like you can get the secrets of authorities conveniently from the global internet. Though it brings us such a lot of advantages, there still have some people who accuse of and oppose globalization. Their reasons concentrate on the diversity of culture which seems to diminish during the progress. So if we can’t ignore either of the cultural impacts and economy utility, w e’d better combined them when re-evaluate going global. Toward a definition of globalization In order to better understand each point of view and to access Kofi Annan’s statement, “It has been said that arguing against globalization is like arguing against the laws of gravity.”We need to explain what is globalization and compare different definitions to have a neutral and general definition on which everybody agrees. The term globalization should be used to refer to a set of social processes that are thought to transform our present social condition into one of globality. At its core, then, globalization is about shifting forms of human contact. Global culture: sameness or difference? Does globalization make people around the world more alike or more different? This is the question most frequently raised in discussion on the subject of cultural globalization. Apparently, global culture homogeneity has immensely enriched the lives of the denizens in developing countries. For instance, now Hollywood blockbusters typically get their first screening in China within a couple of days after their American premiere and youths in China can download singles topping billboard charts from the internet without having to scout around in a CD store. Enhance TV connectivity affords Chinese viewers chances to see primetime American TV shows. This ease of access to a multitude of foreign amusements has really brightened up the lives of many. Conversely, the global cultural sameness severely undermines the cultural diversity in the world. Nowhere is the decline of cultural diversity more manifest than with the youngsters. Today,In Chinese metropolises, it is a common sight that twenty-some things stroll down the billboard-lined sidewalks,sporting Nike sweatshirts and Adidas sneakers,with Motorola cell phones in their hands and Apple’s ipod clipped on their belts. And it is equally commonplace that adolescents. whose hair is dyed yellow or purple, don their baggy outfits and bust moves to hip-hop music. All these seem just so pretentious for a culture that valued modesty, humility and moderation for over three thousand years. In the second place, indiscriminate embracing of the American popular culture diminished the sense of pride and dignity of developing-country peoples. Traditions, rituals, mores and the languages of a culture are all unifying forces of a nation and the decline of them erodes the national identity and national pride of a country. Lastly, cultural westernization breeds massive unemployment in entertainment, publishing and design industries of developing countries. The inundation by foreign products drives local business out of the market and renders vast numbers of professionals jobless.
5.1.2 范例5-1 投诉信 Dear Sir/Madam,亲爱的先生/女士, I am writing to you to complain about the CD Player which I bought in your store in January.After only two days,things started to go wrong.我正写信给你投诉一月份在你们店里买的CD播放机。仅仅两天后,东西就出问题了。 The first problem was the CD drawer,which opened and closed too quickly.I nearly trapped my fingers in it.The next day,I recorded a CD onto a cassette.Everything worked,but the sound quality was very poor.On the following day,the CD Pause button stopped working.第一个问题是光盘屉,它弹出合上太快了。我差点把手指卡进去。第二天,我将一张CD刻录到磁带上。一切都正常,但声音质量很差劲。第二天,CD暂停键停止工作。 Naturally,I returned the player to you for repair.Your assistant said I would have to wait only a week.After two weeks,the necessary spare parts had still not arrived.Eventually,nine weeks later,I collected the stereo.The CD player worked properly,but there was no improvement in the recording quality.自然而然地,我将播放器还给你们返修。你们的助理说我只需要等一个礼拜。两周后,必要的配件部分仍然未到。最后,九周后,我将音响组装起来。CD播放器工作正常,但刻录质量没有得到改善。 I am not satisfied with the equipment nor with the service I have received.I am therefore writing to ask for a full refund.I will return the player to your shop on Monday and I expect to receive a cheque for $250.我对你们的服务和产品都不满意,所以我要求全额退款。我周一会把播放器带到商店,希望能退给我$250。 Yours faithfully,你忠诚的, Johns 琼斯 (181 words) 范例5-2 道歉信 Dear Mr./Ms.,亲爱的xxx女士/先生, I received your letter yesterday complaining that the central heating system in your new house had not been completed by the date promised.I feel awfully sorry that the problem has been caused by my mistake about the date for completion on referring to our earlier correspondence.我昨天收到关于您新房中央供暖系统到期未完工的投诉。对此我感到非常抱歉,这个问题是由于我参照原来的合同弄错了完工时间。 I mistook your date of completion for next week due to my inattention,so the working team installed the system according to the wrong date.I realize the inconvenience that our oversight must be causing you and will do everything possible to avoid any further delay.I have already given instructions for the work to have priority and the engineers working on the job to be placed on overtime.由于我的粗心,将日期记错成下周,所以工程队根据错误的时间安装系统。我意识到我们的疏忽给您带来的不变,我们会尽可能地加快进程。我已经下令将您的事宜优先处理,工程师们会加班完成工作。 I assure you that these arrangements should see the installation completed by next weekend.I hope the settlement of this matter can meet your wishes.我保证这些安排会在下周末完成。希望这种安排您能满意。 The fault is entirely mine and I deeply regret that it happened.(159 words)这个错误完全在我,我对该事深感抱歉。 Yours faithfully, 您忠诚的, Johns 琼斯
剑桥英语10雅思考官范文(大作文+小作文)
剑10 1-2 It is important for children to learn the difference between right and wrong at an early age. Punishment is necessary to help them learn this distinction. To what extent do you agree or disagree with this opinion? What sort of punishment should parents and teachers be allowed to use to teach good behavior to children? One important stage in a child’s growth is certainly the development of a conscience, which is linked to the ability to tell right from wrong. This skill comes with time and good parenting, and my firm conviction is that punishment does not have much of a role to play in this. Therefore I have to disagree almost entirely with the given statement. To some extent the question depends on the age of the child. To punish a very young child is both wrong and foolish, as an infant will not understand what is happening or why he or she is being punished. Once the age of reason is reached however, a child can be rewarded for good behavior and discouraged from bad. This kind but firm approach will achieve more than harsh punishments, which might entail many negative consequences unintended by the parents. To help a child learn the difference between right and wrong, teachers and parents should firstly provide good role modelling in their own behavior. After that, if sanctions are needed, the punishment should not be of a physical nature, as that merely sends the message that it is acceptable for larger people to hit smaller ones-an outcome which may well result in the child starting to bully others. Nor should the punishment be in any way cruel.
英语考试作文 9分雅思图表写作范文全集之地图篇学校 变迁 9分雅思图表小作文范文全集之地图学校变迁The diagrams below show the site of a school in 2004 and the plan for changes to the school site in 2024. 真题传送门:2017全年雅思写作真题范文大汇总(第一时间更新) 范文集结:全部9篇9分雅思写作地图范文汇总放送 范文 The two pictures compare the layout of a school as it was in the year 2004 with a proposed site design for the year 2024. It is clear that the main change for 2024 involves the addition of a new school building. The school will then be able to accommodate a considerably larger number of students. In 2004, there were 600 pupils attending the school,
and the two school buildings were separated by a path running from the main entrance to the sports field. By 2024, it is expected that there will be 1000 pupils, and a third building will have been constructed. Furthermore, the plan is to join the two original buildings together, creating a shorter path that links the buildings only. As the third building and a second car park will be built on the site of the original sports field, a new, smaller sports field will need to be laid. A new road will also be built from the main entrance to the second car park. Finally, no changes will be made to the main entrance and original car park. (183 words, band 9)
作文范文之雅思小作文table
雅思小作文table 【篇一:雅思小作文表格图实例分析】 雅思小作文表格图实例分析 朗阁海外考试研究中心 表格图是雅思小作文的常考图形之一,也是烤鸭们在备考时必须要准备的一类题型。那么烤鸭们具体应该如何准备表格图呢?下面,朗阁海外考试研究中心的专家将以一道具体的实例,就这一题型的解题思路和步骤做出详尽的分析和解答。 the table below shows personal savings as a percentage of personal income for selected countries in 1989, 1999 and 2009. personal savings as a percentage of personal income 一、审题,决定大体写作方式 首先,读题目,了解到这幅表格图是关于“几个国家的人民个人收入中存款的百分比”以及三个时间点(据此,正文部分描述存款率是时态基调为过去时)。表格上方的title和题目表述一样,没有额外信息,因此,读一遍即可。 然后,审具体表格,决定大致写作方向和方式,即分段方式。表格的审图需要注意以下几个方面:横轴,纵轴和总体数据特征。此图中的横纵轴分别是时间和7个研究对象——7个国 家。横纵轴中间有一栏为时间,那说明,此图原则上应该按曲线图原理来写——即,描述7个国家存款率上升或下降趋势;但是,经过下一步对表格中数据总体特征的总结发现:7个国家的存款率在这一段时间内总体呈现下降趋势。这一发现说明,如果继续按照曲线图原理描述,文章会非常单调,而且对比的空间也不大;相反,同一年份里,
Gao Phis Academic Personalized, professional tuloring. 雅思句型翻译练习(2) Day 6 1. 许多人相信科技的最大弊端就是它可能会带来一些难以想象的消极影响。 (disadva ntage) 2. 计算机会使人们丧失想象和创造力这一事实使我相信其是祸而非福。(rather tha n) 3. 毫无疑问互联网的快速发展使得许多人相信它是万能良药,然而情况并非总是如此。 (goes without say ing that …; soluti on) 4. 无可否认,博物馆可以扮演一个教育的作用,因为它给公众提供一个好的机会去研究他们国 家的历史和传统。(play a role in) 5. 许多人没能够意识到这样一个重要的事实:语言的多样性将会极大的推动文化的发展。也许 这就是为什么许多语言现在正处于濒临灭绝的境地。(diversity; enhance; on the verge of) 6. 毫无疑问,家庭成员之间的关系已经不像以前那么亲密。(not as... as...) 7. 广告之所以盛行主要在于它们的信息容量很大。(prevaili ng; in formative) 8. 互连网是如此盛行因此没有人可以避免不受到它的影响。(so…that…)
9. 可想而知,从事兼职工作可以培养学生的独立性和团队合作精神。 (develop) 10. 当前的教育效果远不能让人满意。(results; far from) 11. 造成该现象的最主要原因在于过度工业化似乎已经成了一种无法避免的趋势。(over- industrialization) 12. 文化多元化对人类文明而言就如空气之对于地球。(A is to B what C is to D ) Day 7 13. 造成该现象的原因有许多。 14. 一谈到计算机,人们持有不同的看法。(when it comes to …) 15. 考虑到该问题的严重性,我们必须得想出一些切合实际的措施来解决它。(severe; realistic) 16. 没有人能否认,我们已经进入了一个全球信息化的时代。(age of information) 17. 无疑,有关教育的话题总是能够引起我们的关注。 18. 在当代社会,环保总是能够引起我们的关注。 19. 众所周知,大学的主要作用是培养一个人的全面发展。 20. 可以毫不夸张地说学会如何合作在一个人的职业中是至关重要的因素。