
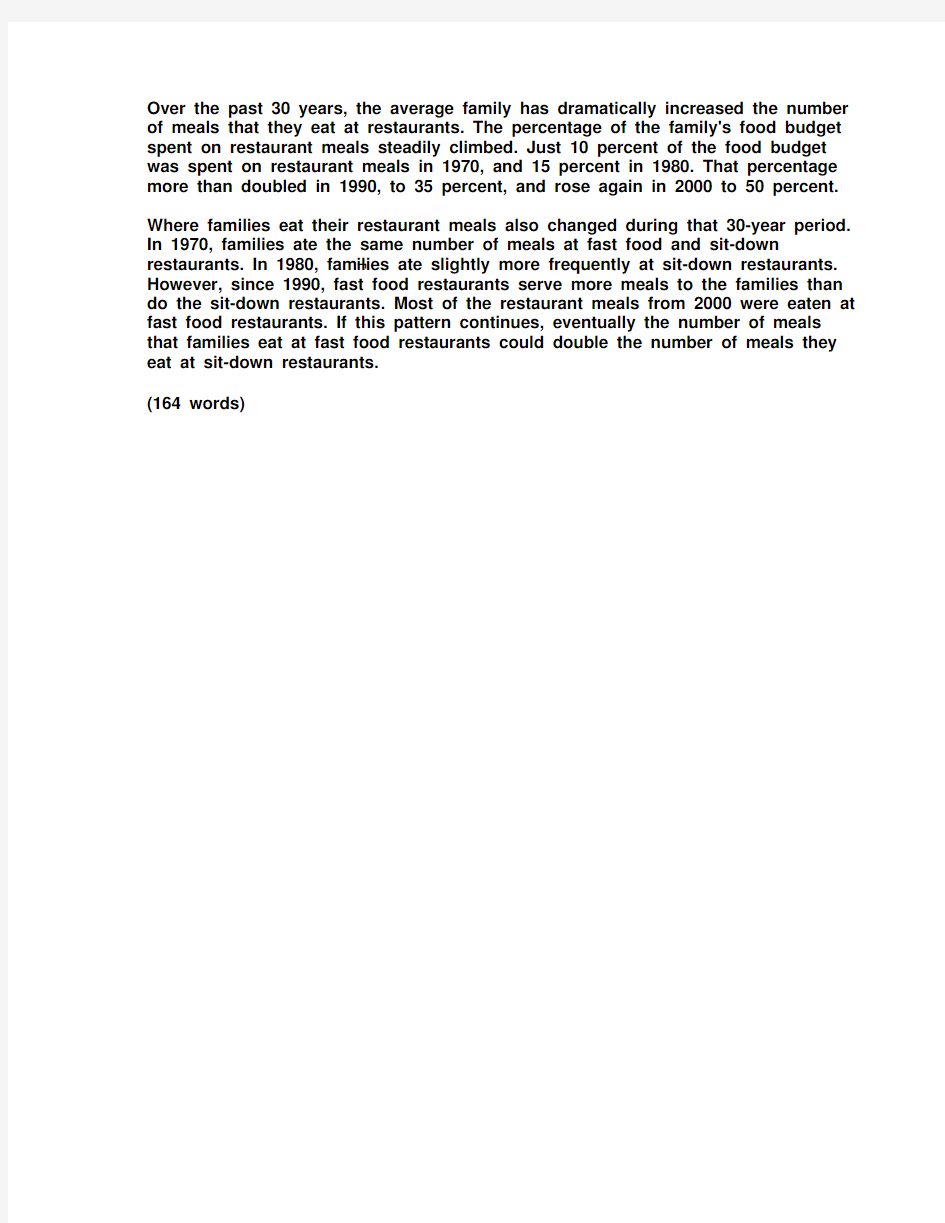
1. The charts below show the percentage of their food budget the average family spent on restaurant meals in different years. The graph shows the number of meals eaten in fast food restaurants and sit-down restaurants. You should write at least 150 words. Give reasons for your answer and include any relevant examples from your own knowledge or experience.
Over the past 30 years, the average family has dramatically increased the number of meals that they eat at restaurants. The percentage of the family's food budget spent on restaurant meals steadily climbed. Just 10 percent of the food budget was spent on restaurant meals in 1970, and 15 percent in 1980. That percentage more than doubled in 1990, to 35 percent, and rose again in 2000 to 50 percent. Where families eat their restaurant meals also changed during that 30-year period. In 1970, families ate the same number of meals at fast food and sit-down restaurants. In 1980, fam?ilies ate slightly more frequently at sit-down restaurants. However, since 1990, fast food restaurants serve more meals to the families than do the sit-down restaurants. Most of the restaurant meals from 2000 were eaten at fast food restaurants. If this pattern continues, eventually the number of meals that families eat at fast food restaurants could double the number of meals they eat at sit-down restaurants. (164 words)
2. You should spend about 20 minutes on this task. The map below is of the town of Garlsdon. A new supermarket (S) is planned for the town. The map shows two possible sites for the supermarket. Summarise the information by selecting and reporting the main features, and make comparisons where relevant. You should write at least 150 words
model answer: The first potential location (S1) is outside the town itself, and is sited just off the main road to the town of Hindon, lying 12 kms to the north-west. This site is in the countryside and so would be able to accommodate a lot of car parking. This would make it accessable to shoppers from both Hindon and Garlsdon who could travel by car. As it is also close to the railway line linking the who towns to Cransdon (25 km to the south-east), a potentially large number of shoppers would also be able to travel by train. In contrast, the suggested location, S2, is right in the town centre, which would be
good for local residents. Theorically the store could be accessed by road or rail from the surrounding towns, including Bransdon, but as the central area is a notraffic zone, cars would be unable to park and access would be difficult. Overall, neither site is appropriate for all the towns, but for customers in Cransdon, Hindon and Garlsdon, the out-of-town site (S1) would probably offer more advantages. (179 words)
3. You should spend about 20 minutes on this task. The table below shows CO2 emissions for different forms of transport in the European Union. The Pie Chart shows the percentage of European Union funds being spent on different forms of transport. You should write at least 150 words.
model answer: The chart shows CO2 emissions per passenger kilometre for variuos methods of transport in the European Union while the pie chart shows European Union spending on transport. Flying by air produces by far the greatest CO2 emissions, approximately three times as much as passenger cars which are the next largest producers. Very little is spent by the EU on air travel while roads make up more than half of the EU transport budget. Trains produce about three times less CO2 emissions per passenger kilometre than passenger cars and eight times less than air travel. Nearly a third of EU transport funds are spent on railways. Ships are a clean form of transport and produce about the same amount of CO2 per passenger kilometre as trains do. However, only 2 percent of EU funds are spent on ports. A further one percent is spent on inland waterways. Coaches are the cleanest form of transport. Emissions of CO2 per passenger kilometre from coaches are half those of buses. Buses emit less than half as much CO2 per passenger kilometre as cars. The European Union spends 10 percent of its transport budget on public transport, such as buses and coaches. (197 words)
4. You should spend about 20 minutes on this task. The table below shows the sales at a small restaurant in a downtown business district. Summarize the information by selecting and reporting the main features, and make comparisons where relevant. You should write at least 150 words. Give reasons for your answer and include any relevant examples from your own knowledge or experience.
Sales: week of October 7-13 Mon. Lunch Dinner $2,400 $3,623 Tues. $2,450 $3,850 Wed. $2,595 $3,445 Thurs. $2,375 $3,800 Fri. $2,500 $4,350 Sat. $1,950 $2,900 Sun. $1,550 $2,450
model answer:
The sales at this small restaurant during the week of October 7 to 13th followed a fairly set pattern from Monday to Friday, and then showed notable shift on the weekend. The lunch and dinner sales during the week peaked on Friday and then dipper down as the weekend set in. During the week of October 7-14th, the lunch sales averaged at approximately $2,400. The highest lunch sales occurred on Friday, and the lowest occurred on Sunday. Sunday's lunch sales were approximately $1,000 less than the average lunch sales during the rest of the week. Dinner sales, which generated at least $1,000 to $1,500 more a day than lunch sales, also remained steady during the week. Just like the lunch sales, the dinner sales peak on Friday and dipped down for the weekend. Excluding Wednesday and Thursday, the lunch and dinner sales from October 711 rose gradually until the end of the business week. Midweek, on Wednesday and Thursday, the sales were slightly lower than they were on Tuesday. According to the sales report, this restaurant has a steady lunch and dinner crowd. The most profitable day during the second week of October was Friday. Sunday, was the least prof?itable day, with the full day's sales totaling/totalling less than the Friday dinner sales. These numbers are reflective of a restaurant that is located in a business/financial district where business hours are Monday through Friday.
# 40. You should spend about 20 minutes on this task. In June 1996, an experimental flu vaccine was trialled in a large country town on females only. Summarise the information by selecting and reporting the main features, and make comparisons where relevant. You should write at least 150 words. Give reasons for your answer and include any relevant examples from your own knowledge or experience.
model answer: The diagrams show data for a flu epidemic which hit a large country town in 1996. Figure 1 gives the number of persons who died; Figure 2 shows the percentage breakdown of females who received a new flu vaccine; and Figure 3 gives the number of cases of flu before and during the epidemic. In Figure 1 it can be seen that the flu was responsible for the deaths of 2 females but no males in the period from March to May. However, from June to August, there were 4 female deaths and 1 male death. According to the pie chart in Figure 2, only those females most at risk were given the new flu vaccine; 28% did not take part in the trial. Of those females who took part, 35% were aged (over 65 years old); 24% were babies or children; and 13% were either hospitalised or receiving other medical attention. From Figure 3 it is clear that the new vaccine had a positive effect on the number of new cases of flu reported in females. There were just over 1000 cases reported in March, climbing rapidly to a peak of 3500 in June. Thereafter, the number of cases dropped slowly to about 2800 in August, before levelling off at 2500 for the rest of the year. For males, the figures were lower but showed a similar trend throughout the epidemic. (232 words)
# 38. You should spend about 20 minutes on this task. The chart shows the number of mobile phones and landlines per 100 people in selected countries. Write a report for a university lecturer describing the information given. You should write at least 150 words.
model answer: The graph shows the number of mobile phones and landlines per 100 users, for selected countries. Overall, most of the countries included in the graph have more mobile phones subscribers than landlines. Most European countries have high mobile phone use. The biggest users of mobile phones are the Italians, with 88 cell phones per 100 people. For example, Italy has twice as many mobile phones as landlines, with 88 mobiles per hundred people compared to 45 for landlines. Mobile phone use is low in Canada, with fewer than 40 phones per 100 people. Denmark is also unusual because it has slightly more landlines than mobile phones. However, in some countries, the number of landlines is higher than the number of mobile phones. One example is the USA, where the number of mobiles, at 50 per 100 people, is much lower than the number of landlines, at almost 70 per hundred. A similar pattern can be seen in Canada. The highest number of landlines in the graph is in Denmark, with about 90 per 100 people. In contrast, the lowest figures for fixed lines are in Italy and the UK. In conclusion, it seems that mobile phone use is higher in Europe than in North America.
#39. You should spend about 20 minutes on this task. The chart below shows estimated world literacy rates by region and by gender for the year 2000. Write a report for a university lecturer describing the information below. You should write at least 150 words.
model
answer:
In this report I will describe a bar chart that shows the estimated world illiteracy rates by gender and region for the year 2000. First I will look at male illiteracy for the 6 areas shown. The lowest rates were in Developed Countries, Latin America/Caribbean and East Asia/Oceania with rates of 1% (approximately), 10% and 8% (approximately) respectively. The rates for the next three areas were much higher and quite similar to each other. Sub-Saharan Africa, the Arab States and South Asia had rates of approximately 31%, 29% and 34%. Female illiteracy was much higher relatively in each area except Latin America/Caribbean where it was only slightly higher. The lowest rates for female illiteracy were again Developed Countries, Latin America/Caribbean and East Asia/Oceania with rates of approximately 2%, 12% and 20%. Again the rates for the next three areas were much higher and quite similar to each other. SubSaharan Africa, the Arab States and South Asia had rates of approximately 48%, 52% and 56%.This ends my report.
# 37. You should spend about 20 minutes on this task. The graphs show enrolment in different colleges in the Higher Colleges of Technology in 1999. Write a total of 150 - 200 words about the information in the three graphs. Write a report for a university lecturer describing the information given. You should write at least 150 words
model answer:
The charts shows student enrolment by gender and level in different colleges of the Higher Colleges of Technology colleges in the UAE. There are clear differences in male and female enrolment. Females outnumber men in all the colleges, with almost 25% more students in Dubai Women's college than in Dubai Men's. Ras Al-Khaimah Women's College has almost 180 students, compared to only 100 in the Men's college. Females also outnumber males by level, with almost double the number of men at Higher Diploma level (330 compared to 181). Only at Diploma level does the number of men slightly exceed that of women. Over half the students are in Certificate level, with less than a quarter at Higher Diploma or Bachelor level. In conclusion, most students in the Higher Colleges are enrolled at Diploma level or below, and the majority of students are women. (143 words)
# 36. You should spend about 20 minutes on this task. The line graph below shows the number of annual visits to Australia by overseas residents. The table below gives information on the country of origin where the visitors came from. Write a report for a university lecturer describing the information given. You should write at least 150 words.
NUMBER OF VISITORS (million) 1975 SOUTH KOREA JAPAN CHINA USA BRITAIN EUROPE Total 2.9 3.2 0.3 0.4 0.9 1.1 8.8 2005 9.1 12.0 0.8 1.1 2.9 4.5 30.4
model answer: The given line graph illustrates information on the number of overseas visitors traveling to Australia in millions of people. Overall, one notable trend seems to be that Australia has steadily become more popular as a destination spot. For example, there were 20 million more visitors to Australia in 2005 than in 1975. That's a jump from 10 million to 30 million in 20 years. The second table gives statistics showing the countries whose residents went to Australia between 1975 and 2005. In both years, the largest number of visitors came from Japan, followed by South Korea and Europe. Britain, the United States and China also had many people traveling to Australia in these years. In fact, the number of people visiting Australia grew in every one of these countries. For example, in 2005, 12 million people went there from Japan compared with only 3.2 million in 1975. (147 words)
#35. You should spend about 20 minutes on this task. The table below shows the consumer durables (telephone, refrigerator, etc.) owned in Britain from 1972 to 1983. Write a report for a university lecturer describing the information shown below. You should write at least 150 words.
Consumer durables Percentage of households with: central heating television video vacuum cleaner refrigerator washing machine dishwasher telephone 1972 1974 1976 1978 1979 1981 1982 1983
39 93 87 73 66 42
43 95 89 81 68 50
48 96 92 88 71 54
52 96 92 91 75 3 60
55 97 93 92 74 3 67
59 97 94 93 78 4 75
60 97 95 93 79 4 76
64 98 18 94 80 5 77
model answer: The chart shows that the percentage of British households with a range of consumer durables steadily increased between 1972 and 1983. The greatest increase was in telephone ownership, rising from 42% in 1972 to 77% in 1983. Next came centralheating ownership, rising from 37% of households in 1972 to 64% in 1983. The percentage of households with a refrigerator rose 2 1% over the same period and of those with a washing machine by 14%. Households with vacuum-cleaners. televisions and dishwashers increased by 8%, 5% and 2% respectively. In 1983. the year of their introduction, 18% of households had a video recorder. The significant social changes reflected in the statistics are that over the period the proportion of British houses with central heating rose from one to two thuds, and of those with a phone from under a half to over three-quarters. Together with the big increases in the ownership of washing machines and refrigerators, they are evidence of both rising living standards and the trend to lifestyles based on comfort and convenience.
#34. You should spend about 20 minutes on this task. The table below shows the figures for imprisonment in five countries between 1930 and 1980. Write a report for a university, lecturer describing the information shown below. You should write at least 150 words
model answer: The table shows that the figures for imprisonment in the five countries mentioned indicate no overall pattern of increase or decrease. In fact there is considerable fluctuation from country to country. In Great Britain the numbers in prison have increased steadily from 30 000 in 1930 to 80,000 in 1980. On the other hand in Australia, and particularly in New Zealand the numbers fell markedly from 1930 to 1940. Since then they have increased gradually, apart from in 1980 when the numbers in prison in New Zealand fell by about 30,000 from the 1970 total. Canada is the only country in which the numbers in prison have decreased over the period 1930 to 1980, although there have been fluctuations in this trend. The figures for the United States indicate the greatest number of prisoners compared to the other four countries but population size needs to be taken into account in this analysis. The prison population in the United States increased rapidly from 1970 to 1980 and this must be a worrying trend.
剑10 1-2 It is important for children to learn the difference between right and wrong at an early age. Punishment is necessary to help them learn this distinction. To what extent do you agree or disagree with this opinion? What sort of punishment should parents and teachers be allowed to use to teach good behavior to children? One important stage in a child 'gsr owth is certainly the development of a conscience, which is linked to the ability to tell right from wrong. This skill comes with time and good parenting, and my firm conviction is that punishment does not have much of a role to play in this. Therefore I have to disagree almost entirely with the given statement. To some extent the question depends on the age of the child. To punish a very young child is both wrong and foolish, as an infant will not understand what is happening or why he or she is being punished. Once the age of reason is reached however, a child can be rewarded for good behavior and discouraged from bad. This kind but firm approach will achieve more than harsh punishments, which might entail many negative consequences unintended by the parents. To help a child learn the difference between right and wrong, teachers and parents should firstly provide good role modelling in their own behavior. After that, if sanctions are needed, the punishment should not be of a physical nature, as that merely sends the message that it is acceptable for larger people to hit smaller ones-an outcome which may well result in the child starting to bully others. Nor should the punishment be in any way cruel. Rather, teachers and parents can use a variety of methods to discipline their young
●批改By Will 本次批改严格按照ILETS小作文评分标准进行。ILETS小作文评分项:TA (内容的完整性), CC (连贯性及一致性), GRA (语法范围及精准度), LR (词汇资源)。文末会进行总评及打分。 ●文中标识: 用词不当逻辑错误语法错误修改添加 The graph provides the information concerning the average temperatures on a month basis in three major cities.(介于有两张图,都要提一下。此后可加一句:In addition, clearly demonstrated in the table are the time of sunshine on an annual base.) (补充:在下一段看到了你对于后一张图的总结,这样的话建议你在开头强调一下“the first graph”) As can be seen from the graph, there is a similar trend in terms of average monthly temperature between London and New York during the period from January to December. (可加入连接词:To be specific) The average temperature in London (介于你后面写的是两个城市的数据,这里改为:for both of the cities) gradually rises from January to July both in London and new york, reaching a peak at 25 degrees and 20 degrees respectively. After that, the following 4 months witness a dramatic decrease both in London and new york. In comparison (这里不妨分段), an opposite trend is found in Sydney. It (这是悉尼的第一句,建议写出来具体的量词至少:The temperature) keeps stable at 25 degrees from January to march, after which the average temperature undergoes a considerable descent, reaching the bottom point at approximately 15 degrees, before there is (there is 没必要了,可以去除) a steady ascent by 10 degrees. It is obvious that the table depicts the average number of hours of sunshine per year in three major cities. As we can see from the statistics, when it comes to the total annual hours of sunshine, new york ranks first, followed by Sydney ,London lies last. Specifically, people who live in new york enjoy 2,353 hours of sunshine every year, which is similar to people living in London with 2,473 hours (不是人和人像,是时间长短像,改为:which is similar to the amount of sunshine for those in London). However, only 1,180 hours of sunshine are found in London annually. 总评6.5(TA6.5 CC6.5 LR6.5 GRA7.0) 1.语法变化上从句数量可以了,分词的使用还可以多一些。偶尔试试一到两句倒装,如我在开头给你的那个。 2.趋势等词汇变化可以,试着多换换题目话题词汇,如people=residents=citizens
作文范文之雅思小作文真题
雅思小作文真题 【篇一:雅思作文题目汇总】 一、教育 1、教育应该包括哪些内容? 母题:it is generally believed that education is of vital importance to the development of individuals and the well-being of societies. what should education consist of to fulfil both these functions? (050312) 提示:本题围绕教育的两大功能来展开(个人与社会),准备好这篇文章,即可应付教育类话题中的最大分支—教育的功能,做到以不变应万变。对于社会角度,可以从促进经济发展、增加社会流动性(social mobility)、维护社会稳定这几个方面来展开,对于个人,可以写改变思维模式、有利于就业和便利生活来写。 子题:大学应当教授理论知识还是实践技能?大学的是应当把学生培养成合格的公民还是让他们自己得益?准备未来职业最好的方法是上大学还是尽快离校积累工作经验?大学要不要扩招?中学阶段应当提供通才教育还是专才教育?要不要延长义务教育年限?要不要让农村地区的学生更容易上学?老师要教学生如何判断是非吗? 2、学校的科目谁来选择?(060916) 母题:some people think that the government should decide which subjects students should study at the university, while others think that students should be allowed to apply for the subject they prefer. discuss the two views and give your opinion. 提示:这类题目采取的策略就是“双批判”,因为题目中提供的两种选择往往都是错误的。
雅思经典小作文柱状图4篇范文+写作要点分析 C1T3 题目 The chart below shows the amount of money per week spent on fast foods in Britain. The graph shows the trends in consumption of fast foods. Write a report a university lecturer describing the information shown below. The chart shows that high income earners consumed considerably more fast foods than the other income groups, spending more than twice as much on hamburgers (43 pence per person per week) than on fish and chips or pizza (both under 20 pence). Average income earners also favored hamburgers, spending 33 pence per person per week, followed by fish and chips at 24 pence, then pizza at 11 pence. Low income earners appear to spend less than other income groups on fast foods, though fish and chip remains their most popular fast food, followed by
Topic 1: When international media (including movies, fashion shows, advertisements and other TV programs) convey the same messages to the global audience, people argue that the expansion of international media has negative impacts on cultural diversity. What is your opinion? 媒体信息一致的缺点: ?国际媒体(global media)—般掌握在少数几个有实力的机构手中(in the hands of a few, large, powerful organizations);有了媒体的宣传(propaganda)后,西方文化成了主流(domineering force),大规模的、有吸引力的广告(mass seductive advertising )唤起了落后地区人们对物质新的向往(create fresh desires),经济联系增强(strong economic ties),西方产品取代了本地产品,使人们更加向往西方的文化; ?文化开始融合在一起(mingle),人们被新的价值观所围绕(bombarded with new values),对自己的文化失去信心和自豪感(confidence and pride),拒绝接受自己的文化传统(rejection of their cultural heritage)转而接受西方的文化习惯(adoption of Western cultural practices);西方媒体削弱了民族的特征(ethnic identity)和社会的凝聚力(social cohesion);因为担心失去观众(a loss of viewers),当地的电视台也开始播放西方的电视节目(television shows), ?国际媒体的普遍会降低世界文化的品质和多样性(degrade the quality and diversity of world culture);文化被商业化(commercialized), —些文化产品(cultural goods),如音乐、服装,都变成了商品(commodities in the marketplace)。因此,即便一些文化在世界其他地方传播,它原来的性质(authenticity)已经丧失。 媒体信息一致的优点: ?国家之间的频繁交往会促进文化之间的交流。因此,相互了解和相互认同的可能性(likelihood of mutual understanding and mutual acceptance )就会增加,这是顺应全球化的趋势; ?未必一定放弃传统观念(not necessarily lead to the abolition of traditional values),事实上媒体可以起到宣传和稳固传统文化的作用; ?主流媒体一般都会反应文化多元性(The dominant media reflect cultural diversity.); —些外国节目其实促进了文化多元性(Most foreign programming is promoting cultural diversity.),适应了当地的条件(adapt to local conditions),注意到了当地文化的敏感性(aware of cultural sensitivity).自我调节来适应市场(exercise self-censorship to suit the market :)。 As international media companies expand across the world, the growing popularity and uniformity of some media programs (such as TV shows, movies, fashion shows) is causing worldwide concern. Many people have strong views toward this trend. In my opinion, international media is closely linked to cultural globalization and cultural homogeneity. The dominance of international media is a sign of Western cultural imperialism and has the potential to thwart cultural diversity. It is not a secret that international media is owned and operated by a handful of giant corporations, such as Time Warner. They control large sectors of the media market and place national media companies at risk. The contraction in the number of media owners will cause a proportional reduction, in the variety of programs broadcasted. For example, painting, music and movies accessible in the media have a small number of genres, imposing restraints on one's knowledge of artworks of different cultural backgrounds. In addition to seizing control over those creative industries, global entertainment companies affect cultural diversity by reshaping the perceptions, beliefs and norms of ordinary citizens in different countries. Most of the cultural values and ideals promoted by the leading mainstream media are of American origin. American culture values individuality, maximization of one's benefits and material wealth, rather than communal life and family solidarity, the values and norms previously treasured in" many Asian countries. Unfortunately, many Asian people now imitate American people, causing the alteration of their perceptions of family. This radical change can be attributed to those movies and TV programs that portray the success of American individuals or corporations.
2019年雅思小作文范文:剑桥雅思5册29页作文-范文模板 本文部分内容来自网络整理,本司不为其真实性负责,如有异议或侵权请及时联系,本司将立即删除! == 本文为word格式,下载后可方便编辑和修改! == 雅思小作文范文:剑桥雅思5册29页作文 This line chart shows the changes in the proportion of the elderly people in three countries from 1940 till today . Moreover , it offers predictions for a period to 2040. 注意趋势描述的语言,对照对比的点和表达方式 During the three score years , the USA generally outweighed Sweden in terms of the proportion of those aged 65 and over . But the gaps between have never been remarkable . In stark contrast , Sweden strikingly eclipsed Japan in this aspect evidenced by the fact that in 1940 the proportion for the USA was about 9%, clearly higher than 5% for Japan . Whereas Japan experienced declines from 5% to 3% , both Sweden and the USA climbed . Put it in detail , by the year 1983, the figures have peaked at 15% and 13% in the USA and Sweden respectively . Noticeably , in 1997 the proportion in the USA was equal to that in Sweden . According to the forecast , from now on , all of the three countries will skyrocket although exceptions might happen . However , by 2040 the proportion will have peaked at 27%, 25%, and 23% in Japan , Sweden , and the USA respectively . In sum , the three countries are different in the field under study .
101. You should spend about 20 minutes on this task. The line graph below gives information about the number of visitors to three London museums between June and September 2013. Summarise the information by selecting and reporting the main features, and make comparisons where relevant. Write at least 150 words. Test Tip Check the horizontal axis to find whether the graph refers to past, present, future or all three. We use the present simple to describe the graph: The graph shows… , We can see… If the graph refers to past period of time, we use the past simple, and if the graph includes future times, we use will or it is predicted that. Look at the line graph and complete the text with the correct forms of the verbs in brackets and the correct prepositions.
1.作文题目:剑桥9 Test3小作文 The charts below give information on the ages of the populations of Yemen and Italy in 2000 and projections for 2050. Summarise the information by selecting and reporting the main features, and make comparisons where relevant. 2.考生原文: These pie charts illustrates what proportion are accounted by human in respective age group of Yemen and Italyin 2002, and predicting the future changes to 2050. In Yemen, 0-14 years old young childrenwere the domain group in 2000, at 50.1%. And smaller proportion of 15-19 years old person in the same period, which was 46.3%. While 50 years past, 15-59 years old people willbecome the mostgroup of people, rising to 57.3%. Although there is a increase in old people who are over 60 years old. But theystill the least group of person, which were risingfrom 3.6% in 2000 to 5.7% in 2005.
雅思写作小作文范文118篇之范文14 以下是三立在线雅思网给大家分享的雅思写作小作文范文118篇:范文14。希望对大家的雅思备考有所帮助,更多雅思备考资料欢迎大家随时关注三立在线雅思网。 范文14 The computer is widely used in education,and some people think teachers do not play important roles in the classroom. To what extend do you agree or disagree? In this period of communication,computer has been used in all kinds of fields widely, and plays a particular role in our lives. Especially computer has become more and more important in educational field, therefore dozens of people considered teachers could be replaced computers that will go with the current of the times. The above point is certainly wrong; this essay will outline three reasons. The main reason is that people’s brain better than computer. Firstly, people design all kinds of computer’s programs. Secondly, computer doesn’t have logistic ideation. Computer only can defend on that designer inputted computer’s programs to judge a question’s right or wrong. In other words, computer can’t defend on thinking that computer independently analyzes a question’s right or wrong. In case, designer inputted programs that are wrong. Computer output the result that also will be wrong. If this kind of problem happened in classroom, students would be infused plenty of wrong information.
剑一--Test 3—Task1 (bar chart combined with line graph) The chart below shows the amount of money per week spent on fast foods in Britain. The graph shows the trends in consumption of fast-foods. Write a report for a university lecturer describing the information shown below. (Model answer 165 words) The chart shows that high income earners consumed considerably more fast foods than the other income groups, spending more than twice as much on hamburgers (43 pence per person per week) than on fish and chips or pizza(both under 20 pence). Average income earners also favoured hamburgers,spending 33 pence per person per week, followed by fish and chips at 24 pence,then pizza at 11 pence. Low income earners appear to spend less than otherincome groups on fast foods, though fish and chips remains their most popularfast food, followed by hamburgers and then pizza. From the graph we can see that in 1970, fish and chips were twice as popular
剑桥雅思作文题目-大作文 目录 IELTS 8 ............................................................. Test 1.......................................................... Test 2.......................................................... Test 3.......................................................... Test 4.......................................................... IELTS 7............................................................. Test 1.......................................................... Test 2 P165..................................................... Test 3 P167..................................................... Test 4.......................................................... IELTS 6............................................................. Test 1.......................................................... Test 2.......................................................... Test 3.......................................................... Test 4 P99 P168................................................. IELTS 5............................................................. Test 1.......................................................... Test 2.......................................................... Test 3.......................................................... Test 4 P99 P169................................................. IELTS 4............................................................. Test 1.......................................................... Test 2.......................................................... Test 3.......................................................... Test 4.......................................................... IELTS 3............................................................. Test 1.......................................................... Test 2.......................................................... Test 3.......................................................... Test 4.......................................................... IELTS 8 Test 1 Task 1 Pie chart Table Task 2 Some people think that parents should teach children how to be good members of society. Others, however, believe that school is the place to learn this. Discuss both these views and give your own opinion. Test 2
xx年雅思大作文范文 7,8月份,掐指一算,社会、生活和工作类题目闪现概率较大,今天范文依旧是工作类题目,推荐学习:雅思大作文每日范文(xx.4.11) Topic:With the wide use of puters and the Inter, people can study and work from home without going to school or pany. Do the advantages outweigh its disadvantages? 利用网络在家工作和学习 思路解析 如果你在家工作,你就不用每天去挤公交和地铁,浪费时间不说,还把人折磨得身心俱疲save a great deal of time and energy. 另外,时间安排会更灵活have a flexible schedule.只 要你能完成任务meet the deadline, 不管你几点开工,很多人早 上9点脑子还没醒过来,而到了晚上他们反而工作起来倍精神。对于学生,如果在网上上课当然也很方便,除了免去上学放学的辛苦,还可以把课程录下来反复听review the course content many times, 无论学霸学渣都可以按照自己的节奏来复习。
关于这种模式的弊端,主要有以下一些:让员工和学生都缺乏面对面的交流face-to-face munication,变得比较疏远bee alienated. 对于员工来说,少了老板的监督和约束supervision and discipline,很多人可能发现工作效率会降低。也许你上下班路上省了俩小时,结果还不够你淘宝、聊天和打游戏的。家里的环境让人放松,估计很多人都觉得在家里缺乏工作的氛围. 最关键的一点是对于学生的影响。本篇范文用到了“剑8-1”的一些素材:学习的目的不只是学知识和获取信息education is not about learning information and acquiring knowledge only,还需要学习与人相处interact with their peers,学习尊敬老师respect their teachers,学习遵守纪律obey school rules,而这些都是远程教学distance learning所无法学到的。 所以文章的结论是:在家工作和上课也许会变得越来越流行popular,但是这种模式只适合某些工作,而且它永远不会取代传统的学校replace conventional schools. ★ 推荐学习
剑桥英语10雅思考官范文(大作文+小作文)
剑10 1-2 It is important for children to learn the difference between right and wrong at an early age. Punishment is necessary to help them learn this distinction. To what extent do you agree or disagree with this opinion? What sort of punishment should parents and teachers be allowed to use to teach good behavior to children? One important stage in a child’s growth is certainly the development of a conscience, which is linked to the ability to tell right from wrong. This skill comes with time and good parenting, and my firm conviction is that punishment does not have much of a role to play in this. Therefore I have to disagree almost entirely with the given statement. To some extent the question depends on the age of the child. To punish a very young child is both wrong and foolish, as an infant will not understand what is happening or why he or she is being punished. Once the age of reason is reached however, a child can be rewarded for good behavior and discouraged from bad. This kind but firm approach will achieve more than harsh punishments, which might entail many negative consequences unintended by the parents. To help a child learn the difference between right and wrong, teachers and parents should firstly provide good role modelling in their own behavior. After that, if sanctions are needed, the punishment should not be of a physical nature, as that merely sends the message that it is acceptable for larger people to hit smaller ones-an outcome which may well result in the child starting to bully others. Nor should the punishment be in any way cruel.